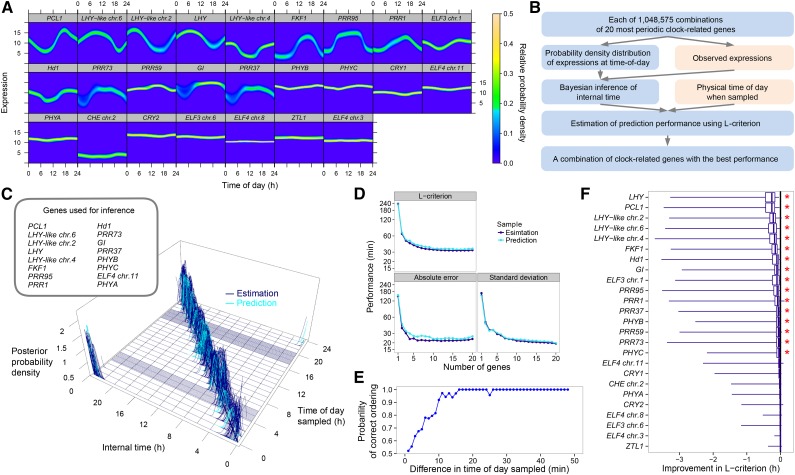
Figure 3.
Inference of Internal Time from the Expression Data of Circadian Clock-Related Genes.
(A) Probability density distributions between physical time of day and expression of the 25 clock genes based on the variation during an entire crop season in 2008. The genes are listed in order of rhythmicity (Supplemental Figure 3).
(B) Time inference process, evaluation, and optimization of performance. Observed variables are in pink and the inference processes in blue. See Supplemental Figure 8A.
(C) Estimation and prediction of internal time using the gene combination with the best estimation performance (i.e., the lowest mean absolute error in estimation). Posterior probability density of internal time is plotted against time of day sampled. Each blue (training sample for estimation; n = 461) or turquoise (validation sample for prediction, n = 125) line corresponds to a single sample. Among the training samples, samples obtained at 10-min intervals at 04:00 to 06:00 and 17:00 to 20:00 are included. Ranges of internal time with zero posterior probability density for those samples are represented as areas with dense blue lines at the bottom of the 3D space. Thick black diagonal line at the bottom of the 3D space indicates the correspondence between internal time and time of day sampled.
(D) Performance of the gene combination with the least L-criterion for each number of genes per combination.
(E) Probability of correct prediction of the sampling order for all possible pairs from 48 sequential samples collected at 1-min (or 2-min) intervals (based on the data in Supplemental Figure 8E).
(F) Contribution of each gene to the estimation performance. Improvement in the L-criterion by inclusion of the gene in the gene combinations is shown. Right ends of the horizontal bars, maximum values; right ends of the boxes, 75% quantile; vertical bars in the boxes, median; left ends of the boxes, 25% quantile; left ends of the horizontal bars, minimum values. Genes are listed in decreasing order of median improvement. Asterisks indicate significant improvement (P < 0.05 by the Wilcoxon signed-rank test with random permutation and Bonferroni correction; Supplemental Table 7).

