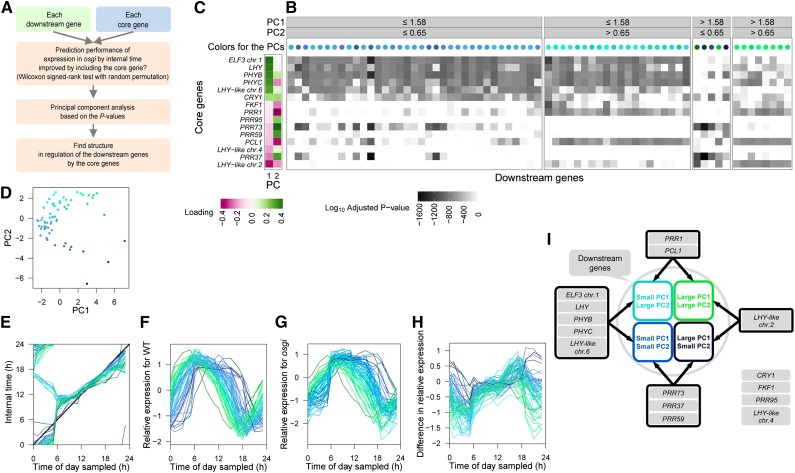
Figure 7.
Structure of Regulation by the Core Genes Revealed by the Perturbed Time Progression in osgi.
(A) A scheme for finding the structure of regulation.
(B) Contribution of 15 core genes to the prediction of expression of downstream genes. Bonferroni-corrected log10 P values for each core gene determined by the Wilcoxon signed-rank test with random permutation are shown as a gray-scaled heat map. PC analysis was performed using the log10 P values for 15 core genes with each downstream gene. The scores of each downstream gene on PCs 1 and 2 are indicated by the colors of the circles above the heat map (as also shown in [D]). Small PC1 values are expressed as blue and large PC2 values green. The same labeling of colors are used to distinguish the 68 downstream genes in (E) to (I).
(C) Loading of the log10 P values of each core gene on PC1 and PC2 scores of the downstream genes.
(D) Scores of PC1 and PC2.
(E) Progression of internal time with the best prediction performance for each downstream gene. The osgi time progression for a downstream gene is shown as a polygonal line connecting the means of expectation of the internal time for each time of day sampled. The thick black line shows time progression along physical time of day.
(F) and (G) Relative expression of predicted downstream genes in the wild type (F) and osgi (G). Log2 expression levels are standardized so that the mean is 0 and sd is 1 for the wild type.
(H) Difference in the relative expression between the wild type and osgi.
(I) Significant relationships between groups of the core genes and downstream gene clusters based on PC analysis.

