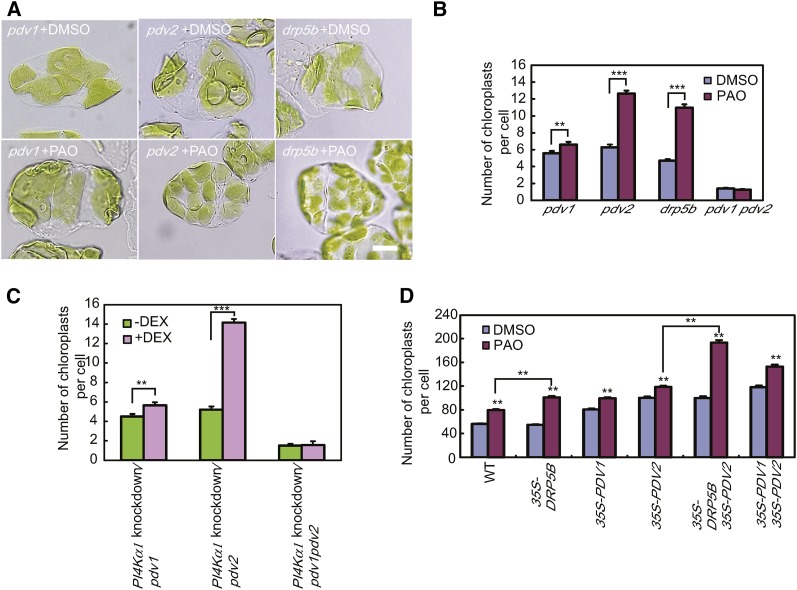
Figure 4.
Effects of PAO Treatment on the Chloroplast Division Rate in pdv1, pdv2, pdv1 pdv2, and drp5b Mutants and PDV1-, PDV2-, and/or DRP5B-Overexpressing Plants.
(A) Chloroplasts of pdv1, pdv2, pdv1 pdv2, and drp5b mutant plants treated or not with 25 μM PAO. Bar = 10 μm.
(B) Statistical comparison of the number of chloroplasts per mesophyll cell of mutant plants treated or not with 25 μM PAO. Error bars represent se (n = 50 cells). **P < 0.01 and ***P < 0.0001 by Student’s t test.
(C) Statistical comparison of the number of chloroplasts per mesophyll cell in PI4Kα1 knockdown/pdv1, PI4Kα1 knockdown/pdv2, and PI4Kα1 knockdown/pdv1 pdv2 mutants. Four-day-old seedlings were transferred onto agar plates with or without 5 μM DEX and grown for 2 weeks. Error bars represent se (n = 50 cells). **P < 0.01 and ***P < 0.0001 by Student’s t test.
(D) Statistical comparison of the number of chloroplasts per mesophyll cell in 25 μM PAO-treated and untreated plants overexpressing PDV1, PDV2, and/or DRP5B. Error bars represent se (n = 50 cells). **P < 0.0001 by Student’s t test.

