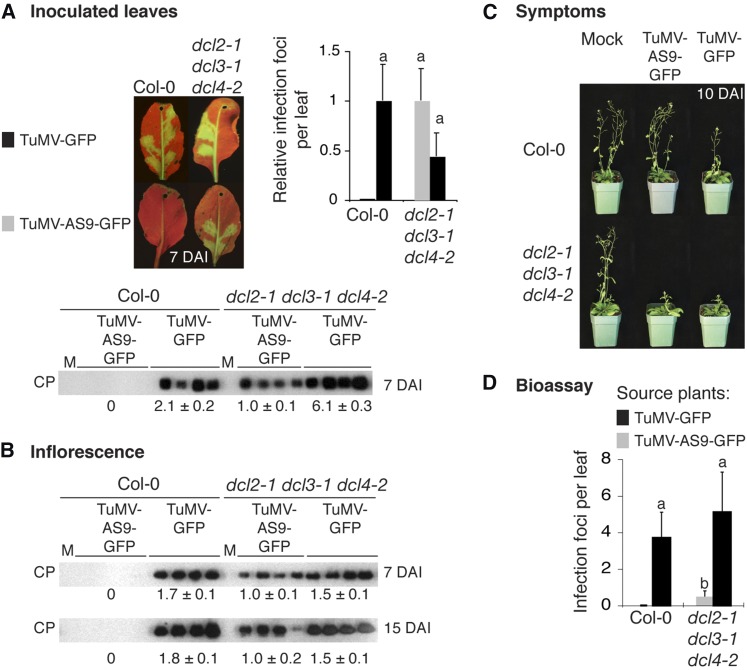
Figure 3.
Local and Systemic Infection of Arabidopsis by TuMV-GFP and TuMV-AS9-GFP.
(A) Infection efficiency and CP accumulation in inoculated leaves at 7 DAI. Images were taken at 7 DAI under UV light. The number of infection foci for TuMV-GFP and TuMV-AS9-GFP was expressed relative to those in Col-0 (2.6 ± 1 foci per leaf) or dcl2-1 dcl3-2 dcl 4-2 (4.6 ± 1.5), respectively. The histogram shows the average + se for 52 leaves and 13 plants per treatment. For each virus, bars with the same letter are not statistically different (Tukey's test with α = 0.01). CP accumulation values (average ± se) were normalized to the average number of infection foci. M, mock inoculated.
(B) CP accumulation in inflorescence clusters at 7 and 15 DAI, relative to TuMV-AS9-GFP in dcl2-1 dcl3-2 dcl4-2 plants. Average + se for each virus-Arabidopsis genotype combination is indicated at the bottom.
(C) Col-0 and dcl2-1 dcl3-2 dcl4-2 triple mutant plants inoculated with TuMV-AS9-GFP or TuMV-GFP (10 DAI) or mock-inoculated.
(D) Bioassay of TuMV-AS9-GFP from systemically infected dcl2-1 dcl3-2 dcl4-2 mutant source plants (15 DAI). Average number of infection foci (+ se) at 7 DAI were plotted. Bars with the same letter are not statistically different (Tukey's test with α = 0.01).

