Figure 2.
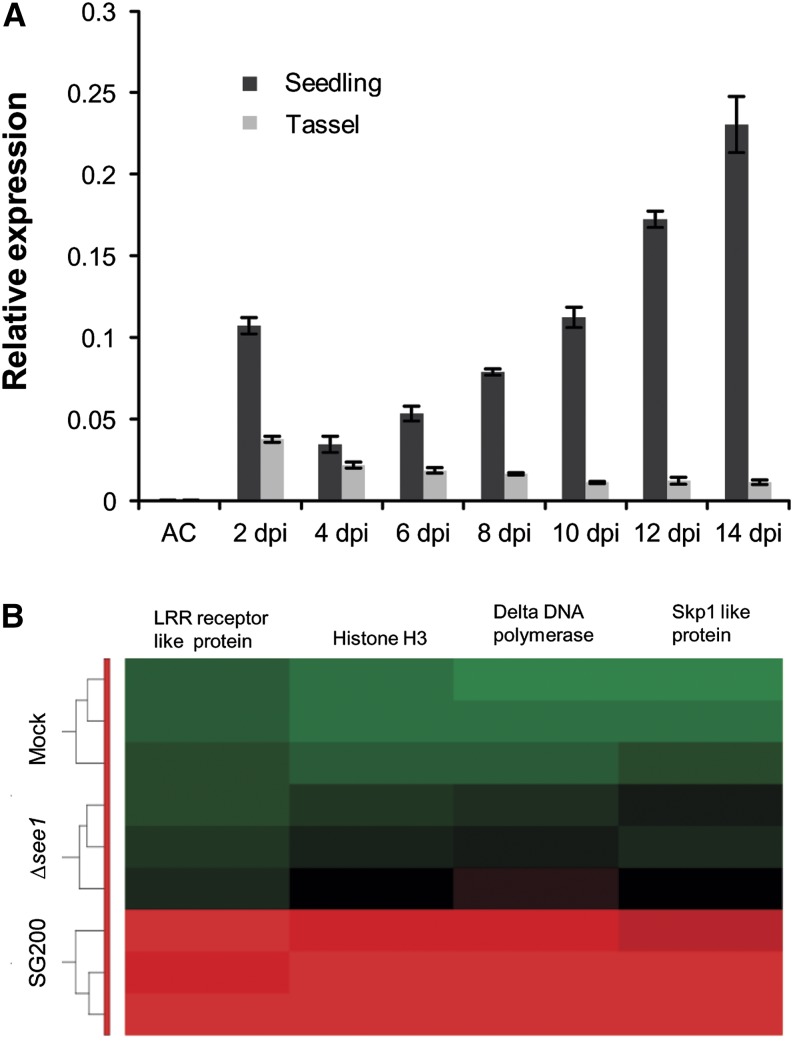
Gene Expression during Maize Colonization with SG200 and SG200∆see1.
(A) RT-qPCR expression profiling of the see1 gene during the biotrophic phase of U. maydis growth in seedling and tassel tissues. Expression levels are shown relative to mean expression of ppi transcripts. Gene expression was analyzed in axenic culture (AC), seedling, and tassel tissues at consecutive time points from 2 to 14 DPI. The experiment was performed in three independent biological replicates.
(B) Transcriptional regulation of the key genes involved in the process of DNA synthesis and histone modification between wild-type SG200- and SG200Δsee1 (mutant)-infected seedlings at 6 DPI. Hierarchical clustering was performed by the Partek Genomics Suite version 6.12 to visualize the expression of maize genes transcriptionally regulated at 6 DPI by U. maydis strain SG200 (bottom), infection by SG200Δsee1 (middle), and mock inoculation (top). The x axis depicts clustering of the microarray samples for each of the three biological replicates for each treatment. The y axis shows clustering of the regulated maize transcripts based on the similarity of their expression patterns. red, upregulated genes; green, downregulated genes; black, not significantly altered. LRR, Leu-rich repeat.

