Figure 4.
See1 Requirement for Host Cell Cycle Release in Leaf Tumor Formation.
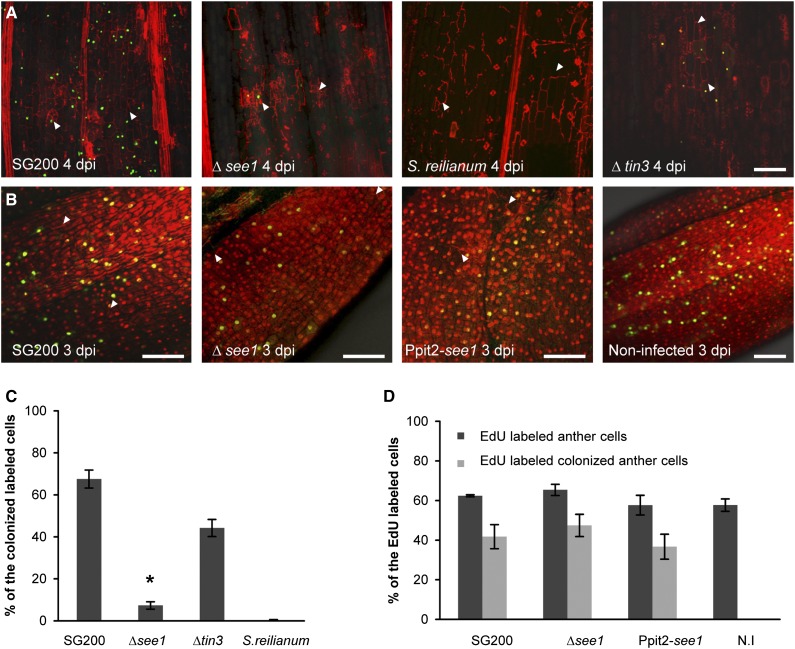
(A) In vivo DNA synthesis in seedling tissue infected with SG200∆see1 in comparison with wild-type SG200. Samples infected with S. reilianum and SG200∆tin3, which has a similar phenotype to SG200∆see1 with respect to tumor size, were used as controls. Fungal hyphae and plant cell walls were visualized by PI staining (red), and the EdU-labeled host cell nuclei are visualized by AF488 staining (green). Fungal hyphae are shown by the white arrowheads. Bar = 100 μm.
(B) DNA synthesis in anther tissue infected with SG200∆see1 in comparison with wild-type SG200. Samples infected with the strain overexpressing See1 and uninfected anthers served as controls (right panel). Nuclei were visualized by PI staining (red), and EdU-labeled host cell nuclei are visualized by AF488 staining (green). Fungal hyphae are marked by white arrowheads. Bars = 100 μm.
(C) Quantification of the EdU-labeled seedling leaf cells in the in vivo DNA synthesis assay comparing infections with wild-type SG200, SG200∆see1, SG200∆tin3, and S. reilianum. Error bars show se. *P ≤ 0.001.
(D) Quantification of the EdU-labeled nuclei relative to total anther nuclei per image examined after infection with wild-type SG200, SG200∆see1, See1-overexpressing strain Ppit2-see1, and noninfected (N.I) tissue. Within the population of EdU-positive cells, the number colonized by fungal hyphae was also quantified in the infected samples. Error bars show se.

