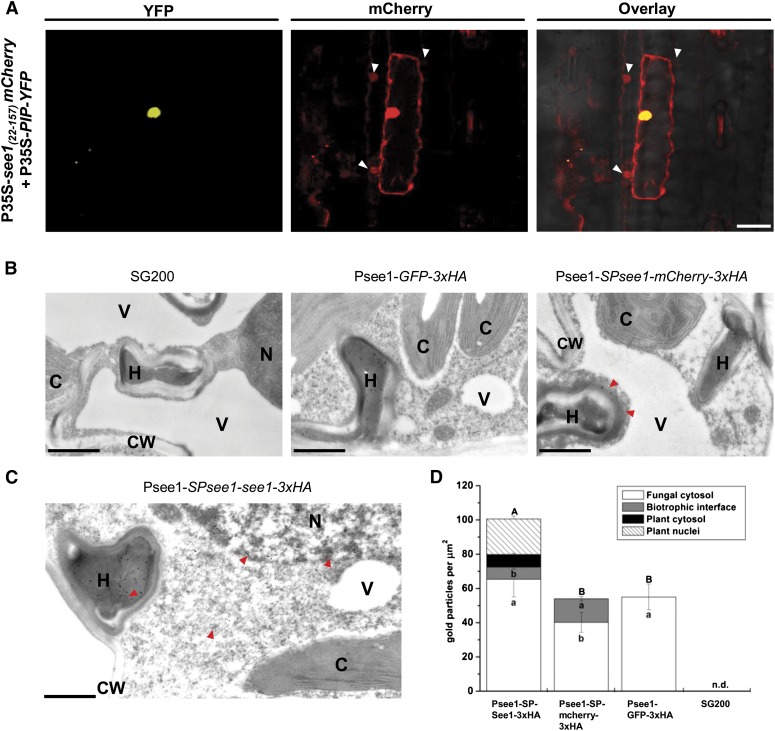
Figure 6.
See1 Localizes to the Plant Cell Cytoplasm and Nucleus.
(A) Confocal microscopy of 35S-see122–157-mCherry transiently expressed in maize epidermal cells. Left panel, transformation with the PIP-YFP control results in fluorescence that is specifically localized to the nucleus. Right panel, See1-mCherry is localized to the cytoplasm and nucleus and is transferred to the adjacent neighboring cells, which are shown by the white arrowheads in the mCherry and overlay channels. Bar = 25 μm.
(B) Controls for the TEM micrographs showing immunogold labeling of See1-3xHA in leaves of U. maydis-infected maize. No gold particles were bound to wild-type infected tissue specimens (left panel). Gold labeling was restricted to fungal hyphae in GFP-3xHA samples, as GFP was not secreted by the fungus (middle panel). Gold particles bound to the secreted mCherry control could be found in hyphae and at the biotrophic interface (red arrowheads) but not inside the plant cells, despite proximity to hyphae. Psee1-SPsee1-mCherry-3xHA expression demonstrates that mCherry is secreted by the fungus but not taken up by the plant (right panel). Bars = 1 μm.
(C) Immunogold labeling of See1 could be found in hyphae (H), the cytosol, and nuclei (N), as shown by the red arrowheads, but not in chloroplasts (C), vacuoles (V), or the cell wall (CW) when the See1 effector was tagged with 3xHA in the strain Psee1-SPsee1-See1-3xHA. Bar = 1 μm.
(D) Graph depicts the spatial distribution of gold particles bound to See1-3xHA in different cell compartments of leaves from Psee1-See1-3x-HA along with the secretory (mCherry-3xHA), nonsecreted (GFP-3xHA), and SG200 wild-type controls. Means are shown with se for the number of gold particles per μm2 in the individual cell compartments of three independent transverse sections. Lowercase letters indicate significant differences (P < 0.05) between the individual cell compartments, whereas uppercase letters indicate significant differences between the total sum of labeling signal for all analyzed cell compartments. Data were analyzed with the Kruskal-Wallis test followed by post-hoc comparison according to Conover (1999). n.d., not detected, for all analyzed cell compartments.

