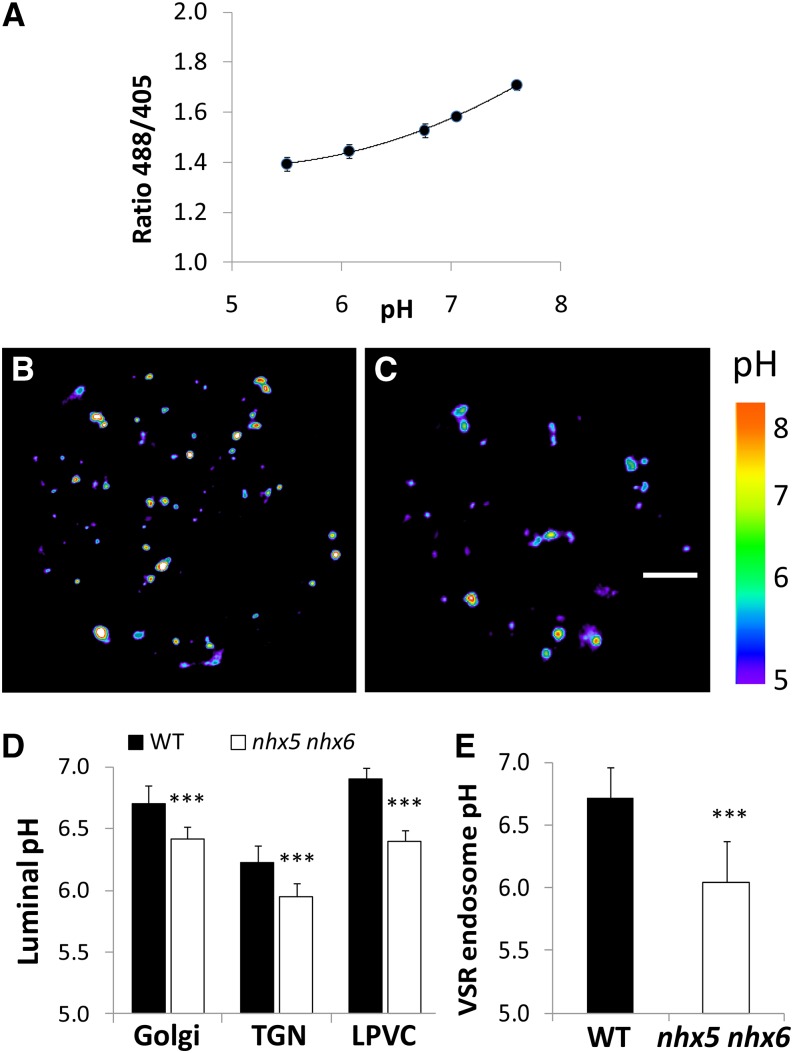
Figure 6.
In Vivo pH of Intracellular Compartments in nhx5 nhx6 Cells.
(A) In vivo calibration curve of endosomal pH. pH calibration was achieved by equilibrating intracellular pH with 10 µM nigericin, 60 mM KCl, and 10 mM MES/HEPES Bis-Tris-propane, pH 5.5 to 7.5.
(B) and (C) Pseudocolored images of the fluorescence ratio (emission 500 to 550 nm from excitation with 488 nm/emission 500 to 550 nm from excitation with 405 nm) resulting from VSR2;1-pHluorin expression in a representative wild-type (B) or nhx5 nhx6 (C) protoplast. The rainbow scale correlates to pH. Bar = 5 μm.
(D) Luminal pH of Golgi, TGN, and the late prevacuolar compartment (LPVC) measured using the compartment-specific pH probes described in Methods. ***P ≤ 0.001; n > 150 from at least 20 protoplasts.
(E) Endosomal pH in protoplasts transiently expressing VSR2;1-pHluorin and Aleu-mRFP indicates that the luminal pH of VSR endosomes that colocalize with aleurain are more acidic in nhx5 nhx6 cells. ***P < 0.001, by t test.

