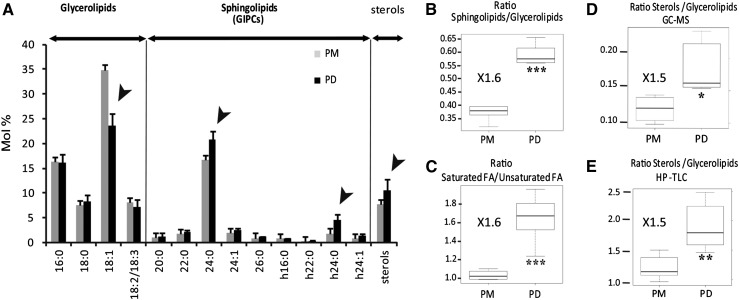
Figure 5.
The PD-PM Domain Is Depleted in Unsaturated Fatty Acids and Enriched in Complex Sphingolipids and Sterols When Compared with the PM.
(A) Total fatty acid profiles (FAMEs) quantified by GC-MS. Sphingolipid (in particular GIPC) species are characterized by VLCFAs (20:0 to 26:0) and hydroxylated fatty acids (h16:0 to h24:1), with the main GIPC-derived acyl groups being 24:0 and h24:0. Long-chain fatty acids (16:0 to 18:3) are mainly derived from glycerolipids. Results are expressed in mol % of a given fatty acid compared with the sum of total fatty acids. Arrowheads indicate changes in fatty acid composition between the PD and PM fractions. Error bars indicate sd.
(B) Ratio between sphingolipids (20:0 to h24:1 fatty acids) versus glycerolipids (16:0 to 18:3 fatty acids), showing a significant enrichment (1.6-fold) of sphingolipids in PD compared with the PM, according to the GC-MS measurement.
(C) Ratio between saturated versus unsaturated fatty acids (GC-MS analysis), showing a significant enrichment (1.6-fold) of saturated fatty acids in PD compared with the PM.
(D) Ratio between sterols versus glycerolipids (GC-MS analysis), showing a significant enrichment (1.5-fold) of sterols in PD compared with the PM.
(E) HP-TLC analysis confirmed the sterol enrichment relative to glycerolipids in the PD fraction compared with the PM fraction.
Asterisks indicate significant differences (*P < 0.05, **P < 0.01, ***P < 0.001) by Wilcoxon test. n = 6 for PD and n = 5 for PM.

