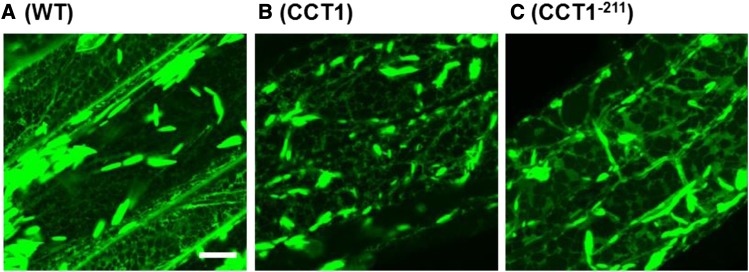
Figure 10.
Effect of CCT1 Overexpression on ER Morphology.
Laser-scanning confocal microscopy images of root epidermal cells from various genotypes expressing the ER lumen marker RFP-HDEL under the control of the CaMV 35S promoter. DM, pah1 pah2; CCT1 and CCT1−211, homozygous lines (a in Figure 9) expressing CCT1 and C-terminal truncated CCT1, respectively, under the control of the CaMV 35S promoter. Bar = 10 μm.

