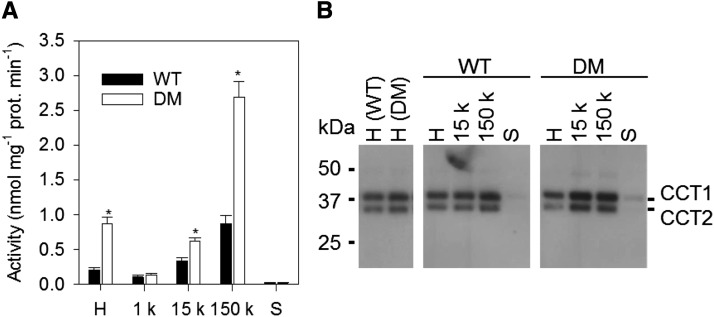
Figure 7.
Subcellular Distribution of CCT in Roots of Wild-Type and pah1 pah2 Plants.
Specific activity of CCT (A) and protein abundance (B) in subcellular fractions. H, crude homogenate; 1 k, 1000g pellet; 15 k, 15,000g pellet; 150 k, 150,000g pellet; S, supernatant. Values are the mean ± se of measurements on four separate fractionations. CCT proteins were detected by immunoblotting using anti-CCT1 antibodies. Asterisk denotes a significant difference from the wild type (P < 0.05).

