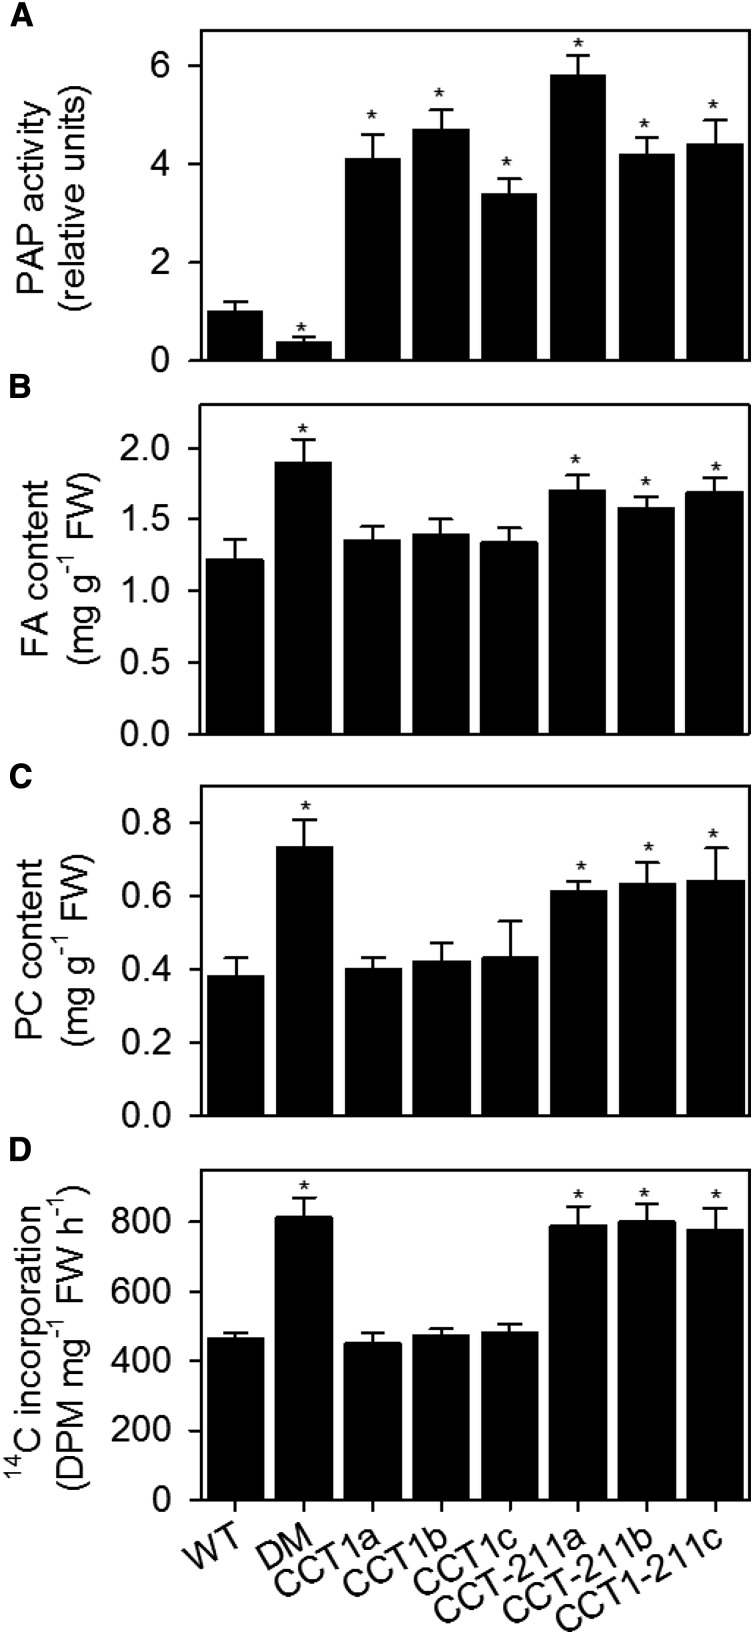
Figure 9.
Effect of CCT1 Overexpression on PC Content.
The PAP activity (A), total fatty acid content (B), PC content (C), and rate of [methyl-14C]choline incorporation into lipids (D) were measured in roots from 4-week-old plants and are expressed on a per unit FW basis. Values are the mean ± se (n = 5). DM, pah1 pah2; CCT1a, b, and c, independent homozygous lines expressing CCT1 under the CaMV 35S promoter; CCT1−211a, b, and c, independent homozygous lines expressing C-terminal truncated CCT1 under the CaMV 35S promoter. Values are the mean ± se of measurements on four separate samples. Asterisk denotes a significant difference from the wild type (P < 0.05).

