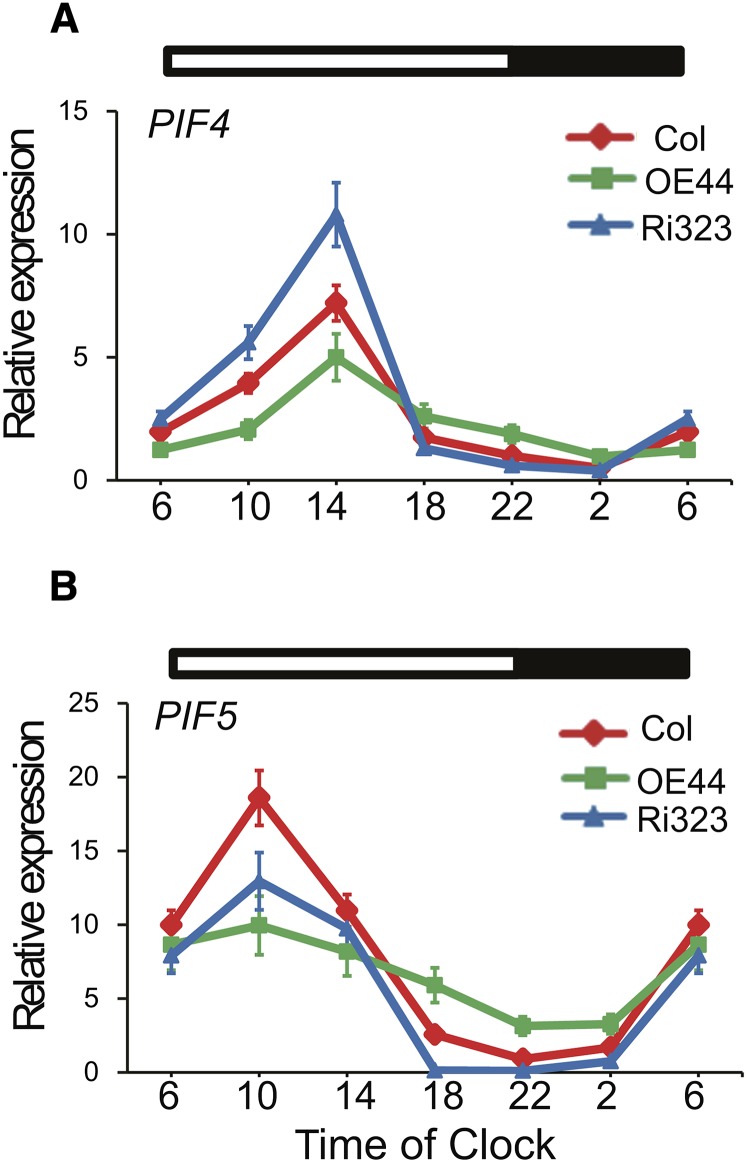
Figure 9.
BBX19 Modulation of PIF4/5 Expression Levels.
Diurnal rhythms of PIF4 (A) and PIF5 (B) expression are shown in Col-0, OE44, and Ri323 lines. Total RNA extracted from these genotypes was subjected to quantitative PCR analysis. The transcript levels of PIF4/5 were normalized to At4g34270 (T1P41-like family protein) and At4g26410 (M3E9) measured in the same samples. The rectangles above the graphs indicate the light (white) and dark (black) conditions. Data are mean fold differences ± sd of three biological replicates each with three technical repeats.

