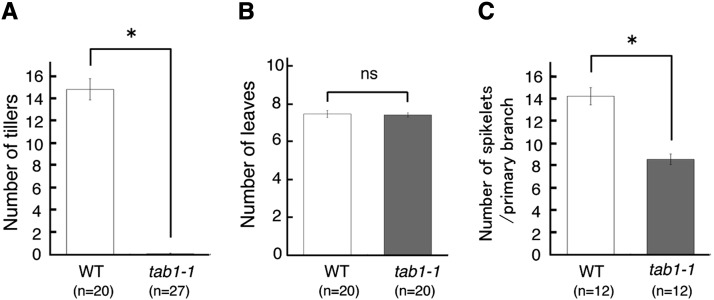
Figure 2.
Comparison of Shoot Phenotypes between the Wild Type and tab1-1.
Comparison of the number of tillers, leaves, and spikelets per primary branch between the wild type and tab1-1 (2-month-old plants) is shown. Asterisks indicate significant differences from the wild type (Student’s t test, P < 1 × 10⁻²¹ [A], P < 1 × 10⁻³ [C]). ns, not significant. Error bars indicate se.

