Figure 3.
Identification of a Low-Activity Mutant of At-PPH1-SD for Trapping the Phosphopeptide Substrate.
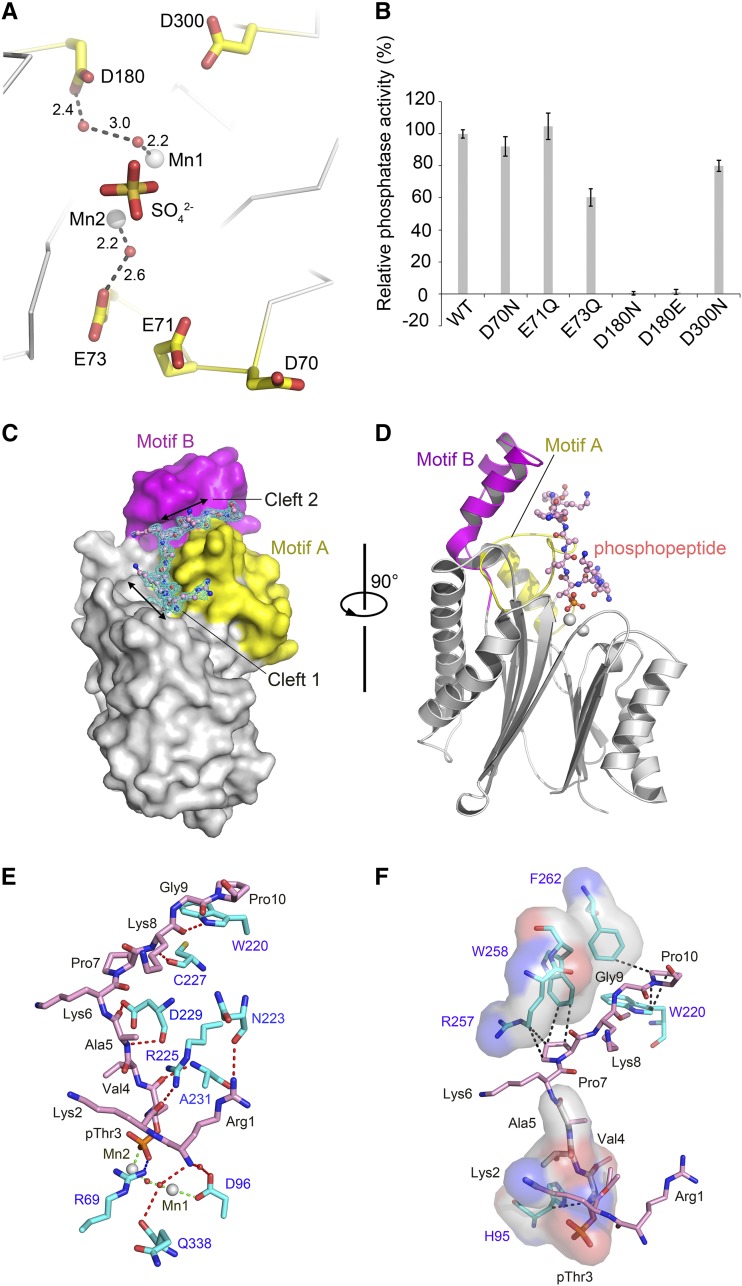
(A) Locations of the five accessory acidic residues around the active site chosen for mutagenesis screening. These residues are not directly involved in coordinating the binuclear center but may participate in the catalytic process. They are positioned nearby the product mimic (sulfate ion). The unit for the numbers labeled nearby the dash lines is Å.
(B) The phosphatase activity of the PPH1-SD mutants relative to the wild-type protein. The error bars denote the standard errors of the mean values (n = 6).
(C) Side-view surface presentation of the D180E mutant of PPH1-SD in complex with the 15mer phosphopeptide of pLhcb1. The core domain, Motif A, and Motif B of PPH1-SD are colored in silver, yellow, and magenta, respectively. The 2Fo-Fc electron density of the phosphopeptide is shown as cyan meshes with 1.0×σ contour level.
(D) A rotated view of the complex structure. For clarity, the phosphopeptide is presented as stick model, while the PPH1-SD is shown as cartoon presentation with the same color codes as in (C).
(E) The polar interactions between the phosphopeptide and PPH1-SD. The red, blue, and green dotted lines indicate the hydrogen bonds, ionic bond, and coordinate bond, respectively. The carbon atoms of the amino acid residues from PPH1-SD and the phosphopeptide are colored in cyan and pink, respectively. The water molecules are shown as red spheres.
(F) The hydrophobic and van der Waals interactions between the phosphopeptide and PPH1-SD. The regions on PPH1-SD involved in binding the phosphopeptide through hydrophobic interactions are shown as transparent surface models superposed with stick models. The van der Waals interactions are indicated by the dark dotted lines.

