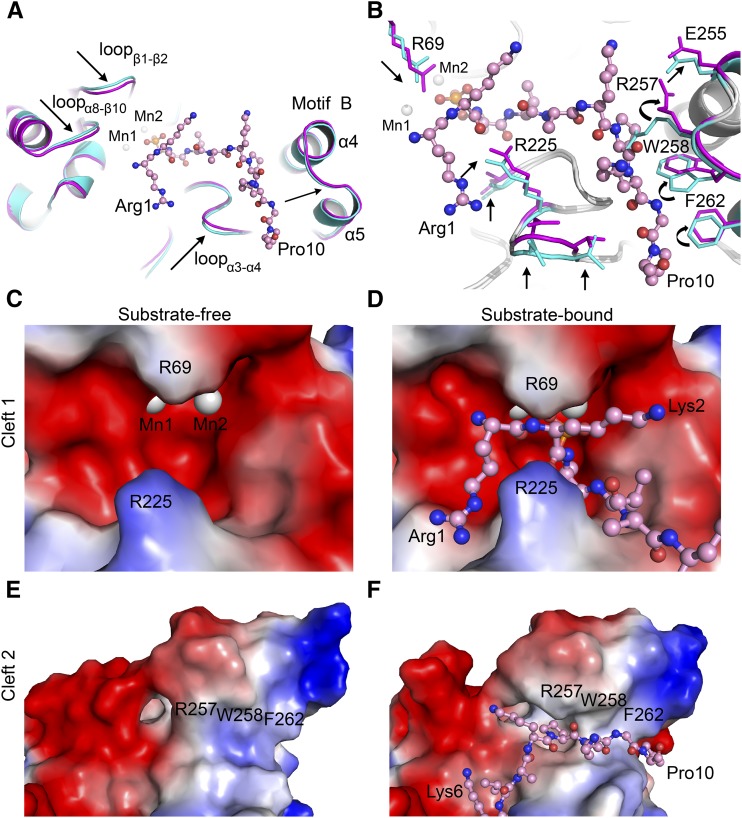
Figure 4.
Conformational Changes in At-PPH1-SD Induced by the Binding of Phosphopeptide.
(A) Movement of the loop regions on PPH1-SD induced by phosphopeptide binding. The phosphopeptide is shown in ball-and-stick model, while the PPH1-SD is presented as cartoon models. The substrate-free and substrate-bound states of PPH1-SD are colored in cyan and magenta, respectively. The arrows indicate the movements of polypeptide backbone of PPH1-SD induced by substrate binding.
(B) Rearrangement of the side chains of amino acid residues on PPH1-SD upon substrate binding. The residues with evident conformational changes are indicated by the arrows.
(C) and (D) Comparing the shapes of Cleft 1 site on PPH1-SD under substrate-free (C) and substrate-bound (D) states.
(E) and (F) Cleft 2 site under substrate-free (E) and substrate-bound (F) states. The electrostatic potential surface models of PPH1-SD (zoom-in views on the Cleft 1 or Cleft 2 regions) are presented. Red, electronegative; blue, electropositive.

