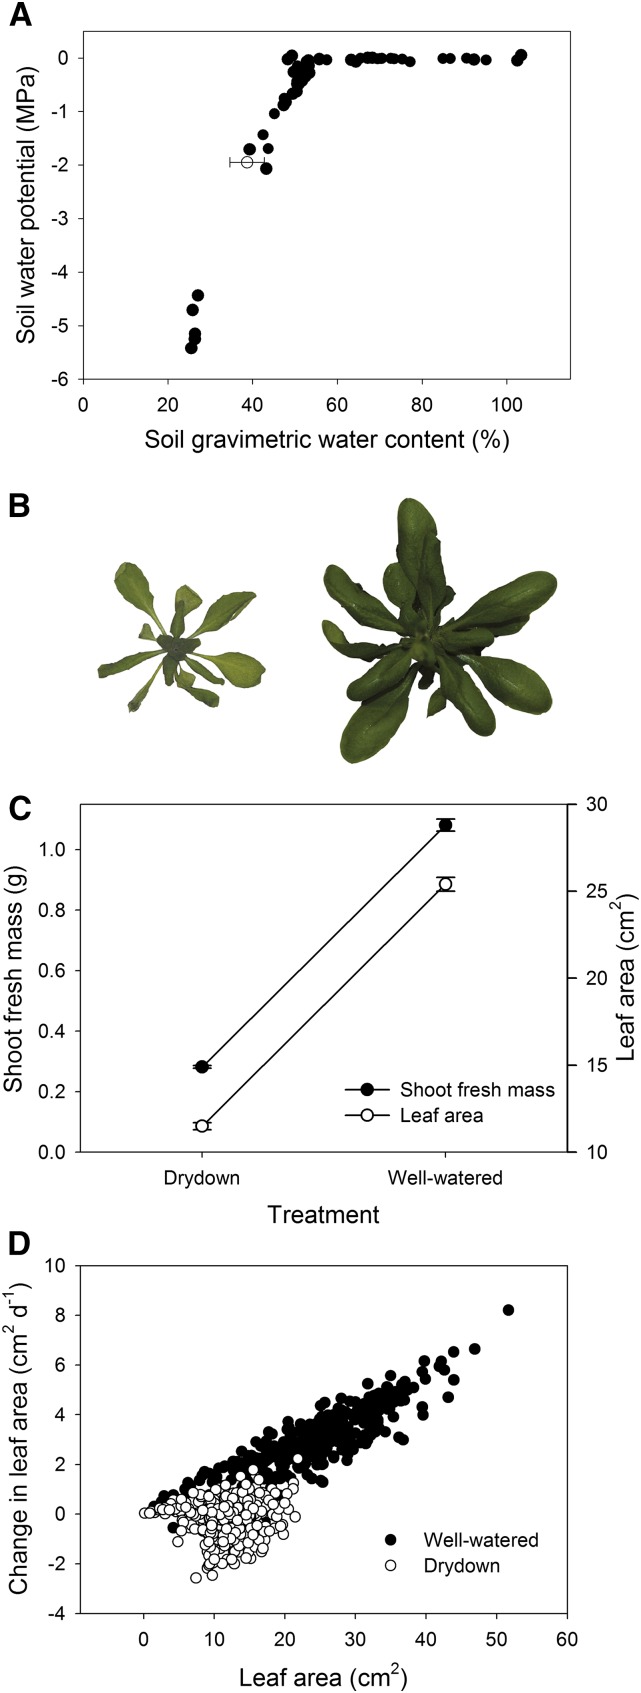
Figure 1.
Physiological Effects of the Experimental Drought on Leaf Growth.
(A) Soil moisture release curve. Closed circles represent measurements of soil water potential across a range of soil water content. The open circle shows mean soil moisture at the end of the dry-down treatment. These data were used to estimate water potential for the dry-down treatment.
(B) Isolated overhead image of a genotype (KT207) in drought (left) and well-watered (right) conditions. The images have the same scale and color adjustments.
(C) Reaction norms for shoot fresh mass under different water availability treatments.
(D) Dependence of the change in leaf area during the treatment on total leaf area. For the wet treatment, r = 0.87, and for the dry treatment, r = 0.06.

