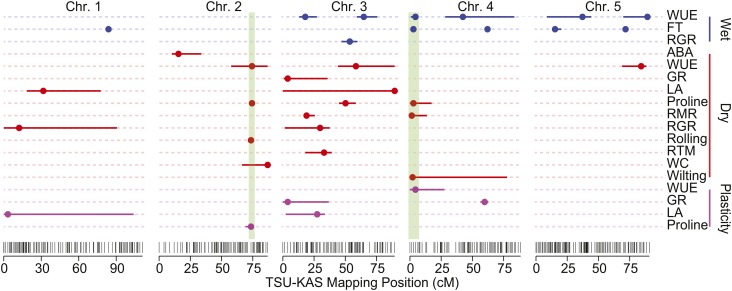
Figure 2.
Mapping Positions of Significant QTLs.
QTL point estimates (filled circles) and accompanying drop 1.5 (solid colored lines) confidence intervals for all phenotypes with significant multiple QTL models. Phenotypes in red were collected in the drought treatment. Blue-labeled phenotypes were from the “wet” treatment, and purple traits are plasticity estimates. The two focal regions for candidate gene method validation are highlighted in green.

