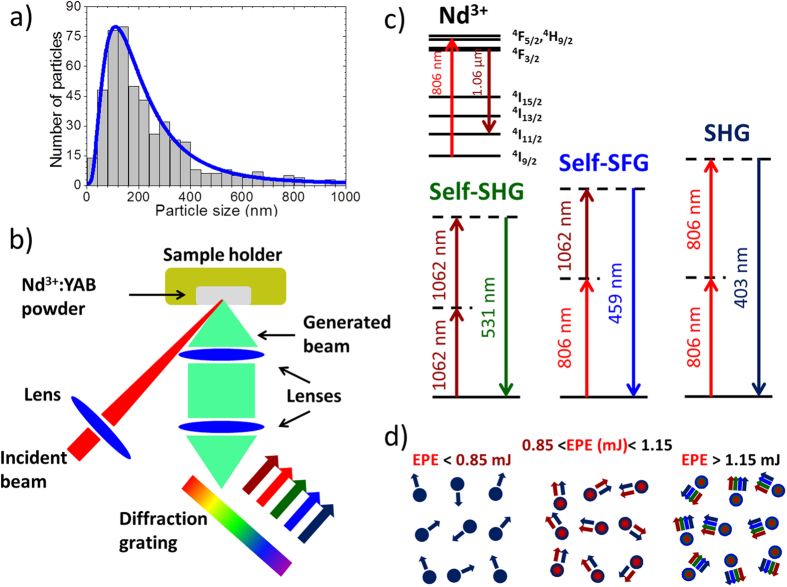
Figure 1. Size distribution of the powder grains, optical experimental representation, pictorial description of the internal processes in the Nd:YAB powder, and energy level diagrams of the internal processes.
(a) Size distribution of the Nd:YAB powder grains. (b) Schematic of the experimental setup shown the disordered powder excited at 806 nm emitting at 1062, 531, 459, and 403 nm. (c) Energy level diagrams associated to the frequency conversion processes. (d) Processes inside the Nd:YAB grains for different ranges of excitation pulse energy: excitation second-harmonic generation (SHG) (dark blue), random laser (RL) emission (dark red), self-SHG (green), and self-sum-frequency generation (Self-SFG) (blue).

