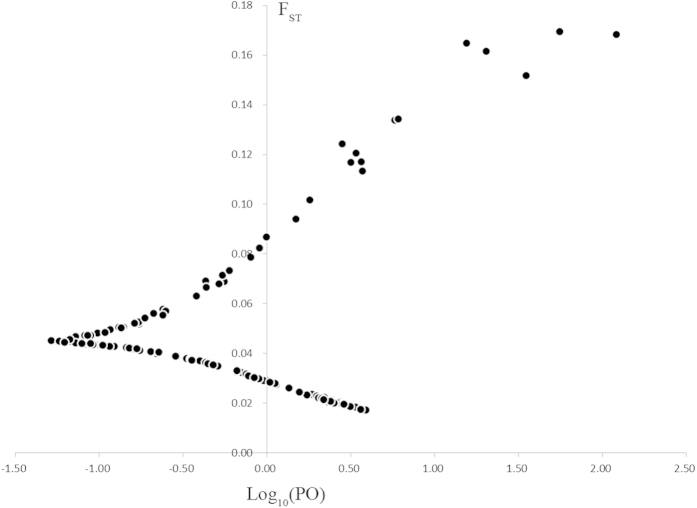
Figure 3. BayeScan 2.0 plot of 224 polymorphic amplified fragment length polymorphisms markers in global enhanced genome scan analysis of 393 individuals from the C kiangsu populations from China.
FST is plotted against the log10 of the posterior odds (PO). The vertical line shows the critical PO used for identifying outlier markers. The 15 markers on the right side of the vertical line are candidates for being under positive selection.

