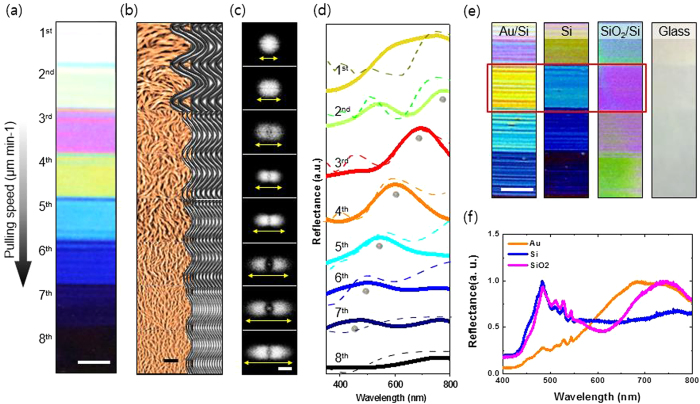
Figure 2. Modification of M13 phage colour film by various processes.
(a) With a simple pulling method, an M13 phage photonic crystal structure was deposited on an Au wafer. We fabricated various different colour bands by precisely modulating the pulling speed. Scale bar = 1 cm (b) AFM image set of a self-assembled M13 phage nanostructure (left, AFM image; right, schematic diagrams). Measurements were taken at each band. With increasing pulling speed, the bundle width and bundle-to-bundle distance decrease. As a result of the dense nanostructure, the scattering wavelength shifts from red to blue. Scale bar = 5μm (c) Fast Fourier transform (FFT) analysis of the AFM image was performed to demonstrate the quantitative difference of the spatial order of the colour bands. A denser photonic crystal nanostructure leads to a more diffuse FFT pattern. Scale bar = 1.6 μm−1 (d) Reflectance spectrum (full line) and simulated reflectance spectrum (dashed line) of the virus colour film. All spectra were normalized to demonstrate the tendency of peak wavelengths. (e) Virus colour films deposited on different substrates. Each colour film was assembled under the same conditions. They showed different colours despite having photonic crystal structures of the same spatial order. Scale bar = 1 cm (f) Reflectance measurement confirmed the effect of the substrate materials.

