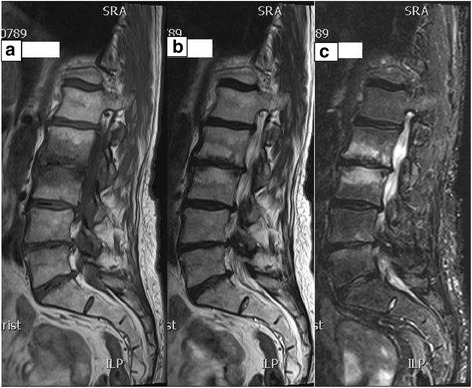
Fig. 2.

a, b and c Modic type I changes. T1, T2 weighted and fat suppressed sagittal MR images of a patient demonstrating low signal intensity adjacent to L2-3 disc on T1 weighted images (2a) and high signal intensity on both T2 weighted image (2b) and fat suppressed image (2c), consistent with MC type I (marrow edema) at L2 through 3
