Fig. 4.

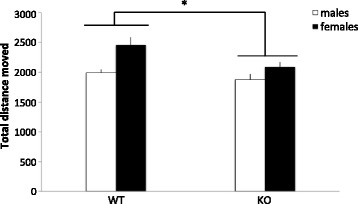
Spontaneous locomotor activity in the open field (cm/6 min) in MIF KO compared to WT littermate controls. Columns represent mean + SEM. *p < 0.05 compared to WT animals (ANOVA) (n = 10–16 animals per group)

Spontaneous locomotor activity in the open field (cm/6 min) in MIF KO compared to WT littermate controls. Columns represent mean + SEM. *p < 0.05 compared to WT animals (ANOVA) (n = 10–16 animals per group)