
Fig. 5.
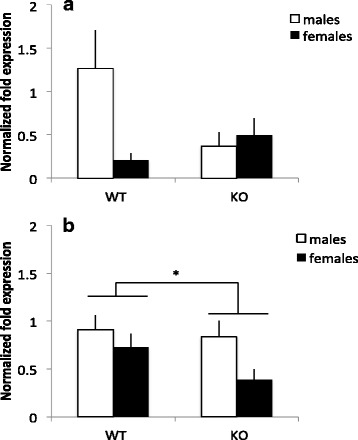
Normalized fold mRNA expression of IFN-γ in MIF KO and WT mice in the a prefrontal cortex and b hippocampus. Columns represent mean + SEM. *p < 0.05 compared to WT animals (ANOVA) (for (a), n = 7–8 per group, and for (b), n = 6–8 per group)
Official websites use .gov
A
.gov website belongs to an official
government organization in the United States.
Secure .gov websites use HTTPS
A lock (
) or https:// means you've safely
connected to the .gov website. Share sensitive
information only on official, secure websites.
Normalized fold mRNA expression of IFN-γ in MIF KO and WT mice in the a prefrontal cortex and b hippocampus. Columns represent mean + SEM. *p < 0.05 compared to WT animals (ANOVA) (for (a), n = 7–8 per group, and for (b), n = 6–8 per group)