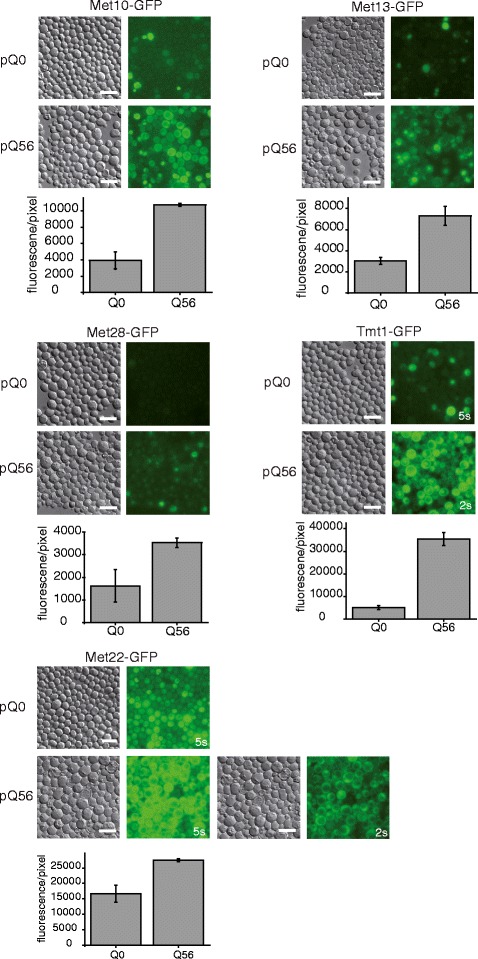
Fig. 5.

Up-regulation of Met10p, Met13p, Met22p, Met28p,and Tmt1p fused to GFP monitored on protein level. Exposure time is not changed between Q56-mCherry and Q0-mCherry cells if not stated otherwise. DIC and GFP pictures are shown. Quantification was performed with ImageJ. For a detailed description see methods section. GFP strains used in this work are listed in Additional file 16. Scale bar represents 10 μm
