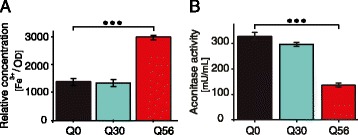
Fig. 6.

Iron concentration and aconitase activity in Q56-YFP and Q0-YFP yeasts. a Relative concentration of intracellular free iron in yeast cells expressing Q0-YFP, Q30-YFP or Q56-YFP determined by EPR spectroscopy. Yeasts were treated with DETAPAC and DFO to complex iron and resuspended to an OD595 = 300 in HEPES buffer. Results are expressed as mean ± SEM (n ≥ 3). b Aconitase activity of yeast cells expressing Q0-YFP, Q30-YFP or Q56-YFP was determined colorimetrically. Results are expressed as mean ± SEM (n ≥ 3). Statistical significance is indicated by three stars (α = 0.005)
