Fig. 7.

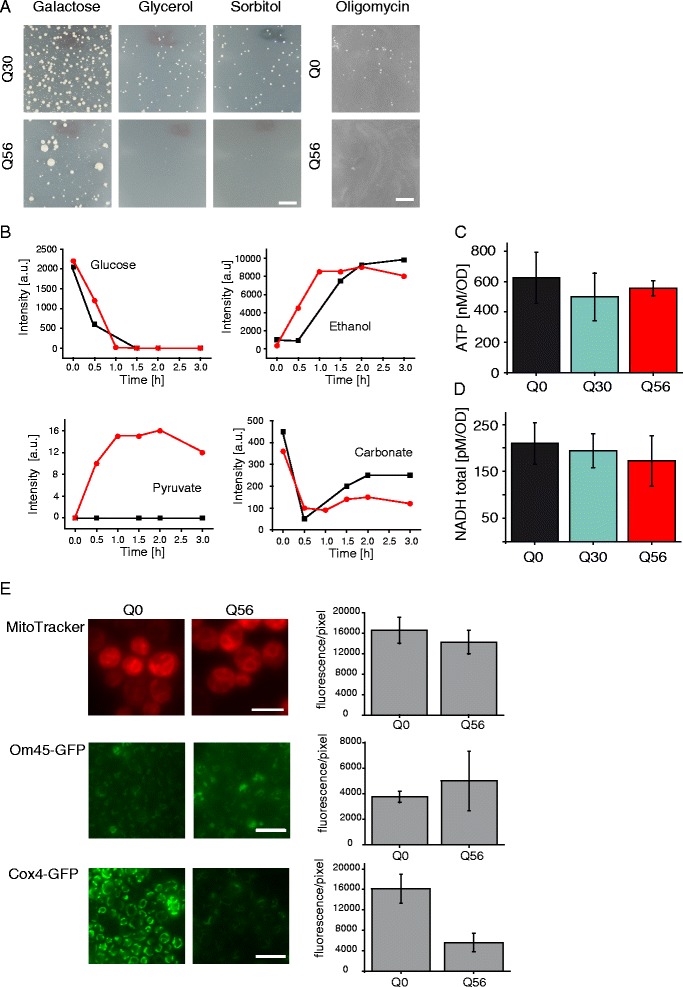
Alteration in carbon metabolism upon polyQ intoxication. a Growth of transformed yeasts was monitored after 8 days of incubation. The pica phenotype of Q56-YFP is enhanced when BY4741 cells are grown on SD media containing 2 % sorbitol or 2 % glycerol. The pica phenotype is unchanged if cells are grown on 2 % galactose as a carbon source compared to glucose. Upon respiratory chain inhibition by adding oligomycin no growth is observable after pQ56 transformation. The scale bar represents 10 mm. b Yeast were resuspended to an OD595 = 150 and [U-13C6]-glucose was added at time point 0. Spectra were recorded for 3 h by NMR. The kinetics of glucose consumption are based on the peak at 75.8 ppm and ethanol production based on the peak at 16.7 ppm in pQ0- (black square) and pQ56- (red circle) transformed yeasts. The kinetics of pyruvate accumulation are based on the peaks at 169.9 ppm and carbonate production quantified based on the peak at 160.3 ppm in pQ0- (black square) and pQ56- (red circle) transformed yeasts. The chemical shift positions are assigned in Additional file 13 and Additional file 14F and G. c ATP-level of Q0-YFP, Q30-YFP and Q56-YFP yeasts was determined using a luciferase coupled assay. Means and SEM are depicted. Six biological replicates were analyzed. The detected differences are not significant. d NADH-level of Q0-YFP, Q30-YFP and Q56-YFP yeasts. The detected differences are not significant. e) MitoTracker staining in Q56-YFP and Q0-YFP expressing cells. Expression time is not changed between samples. Scale bar represents 5 μm for MitoTracker. Expression pattern of Cox4p and Om45p fused to GFP. Exposure time is not changed between Q56-mCherry and Q0-mCherry producing cells. Scale bar represents 10 μm for Cox4-GFP and Om45-GFP. Quantification was carried out as described in the methods section. Mean fluorescence per pixel is plotted with SD
