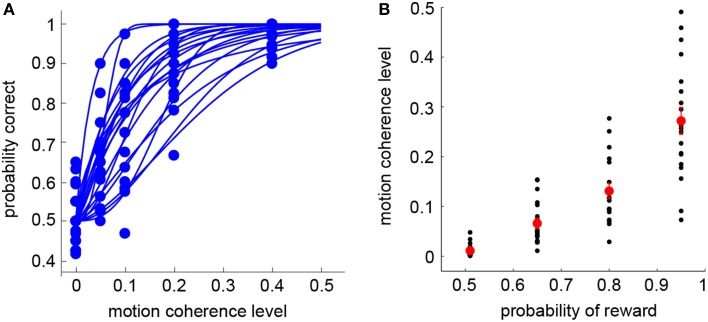
Figure 2.
Behavioral results: RDM task (Session 1). (A) Psychometric functions in the RDM discrimination task (Session 1). Each curve represents a single subject. (B) Motion coherence levels used in the visual lottery decision task (Session 2) are plotted against their corresponding probabilities of reward. The black dots indicate data from individual subjects. The red dots indicate the mean of the motion coherence level averaged across subjects. Error bars represent ±1 SEM.

