Figure 3.
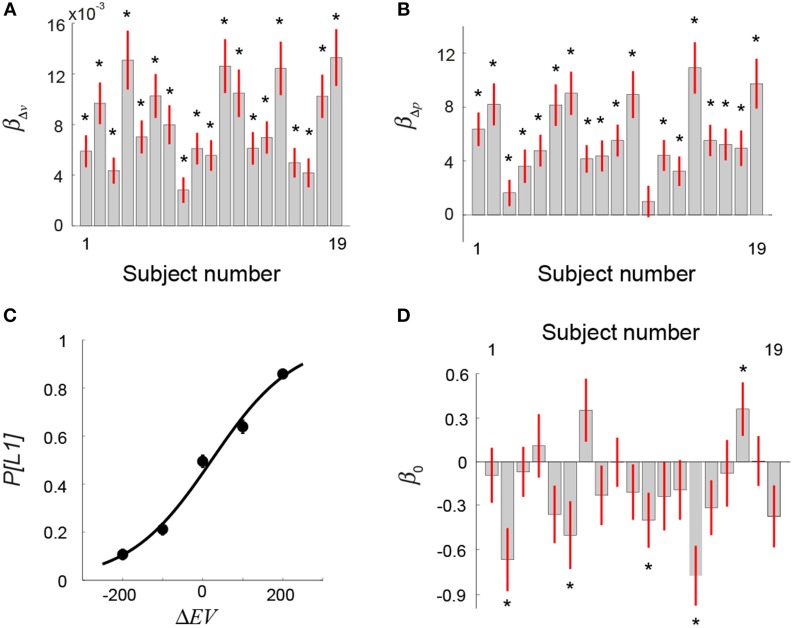
Behavioral results: Visual lottery decision task (Session 2). (A,B) Logistic regression analysis on choice against difference in reward value (Δv) and on reward probability (Δp) between the two lotteries. (A) Beta estimates of Δv separately estimated for each subject. (B) Beta estimates of Δp separately estimated for each subject. (C) Mean frequency of choosing the first lottery (P[L1]) (averaged across subjects) as a function of the difference in EV between L1 and L2 (ΔEV = EVL1−EVL2). (D) Beta coefficient of the intercept (β0) in the logistic regression analysis on choice that used ΔEV as the regressor (Equation 1 in Results). The star symbol indicates statistical significance (p < 0.05, one-sample t-test). Error bars represent ±1 SEM.

