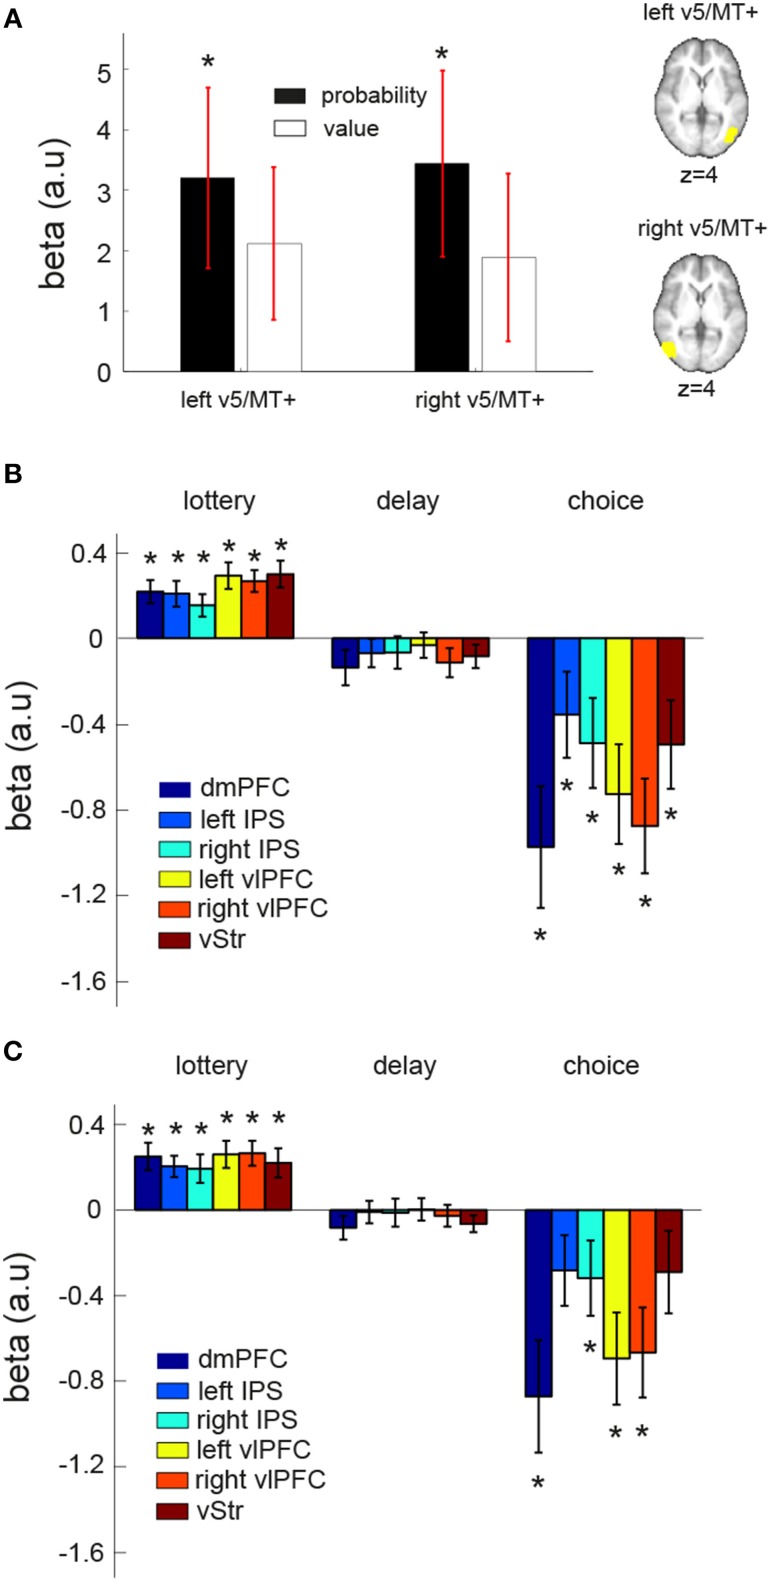
Figure 6.
ROI and connectivity analyses on area V5/MT+. (A) Anatomically defined left and right V5/MT+ showed significant correlation with reward probability (black) but not reward value (white) at the time when lotteries were presented. (B,C) Psycho-physiologic interaction (PPI) analysis. We investigated the changes in functional connectivity between a seed region (left V5/MT+ or right V5/MT+) and the EV-coding regions (dmPFC, vStr, left vlPFC, right vlPFC, left IPS, right IPS) at different stages during a trial: “lottery” indicates the time where the lottery information was revealed, “delay” indicates the fixation period between the first lottery and the second lottery, and “choice” indicates the time where subjects made a button-press response to indicate his or her lottery choice. The mean beta estimate of each PPI contrast of each EV-coding region is plotted. (B) Left V5/MT+ as the seed region. (C) Right V5/MT+ as the seed region. The star symbol indicates statistical significance (p < 0.05, one-sample t-test for each contrast at each ROI). Error bars represent ±1 SEM.

