
Fig. 4.
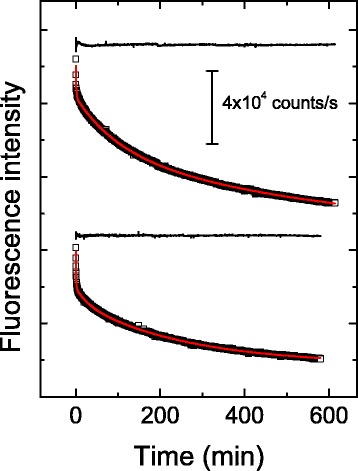
Kinetics of yTIM unfolding at pH 8.0, as followed by fluorescence intensity. Data shown correspond to 55.0 °C (upper tracing) and 60.0 °C (lower tracing). Protein samples were excited at 292 nm, and the light emitted at 318 nm was collected. Red lines are least-squares fits of triple exponential decay equations to experimental data (see Methods). Residuals from fit (black lines) are shown above each kinetic tracing