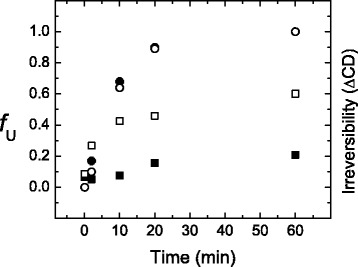
Fig. 8.

Time course for the appearance of irreversibility on the unfolding of yTIM. Samples of yTIM were unfolded (63.0 °C) for different time spans, and then cooled to 25 °C for recording of CD spectra. Irreversibility was then calculated as the difference in ellipticity (220 nm) between cooled-down samples and native yTIM, normalized to the ellipticity of the native protein. Irreversibility data are represented by open (pH 6.7) or solid (pH 8.0) squares. Open (pH 6.7) and solid (pH 8.0) circles correspond to the fraction of unfolded protein, f U, which was calculated from eqn. S3 in Additional file 5
