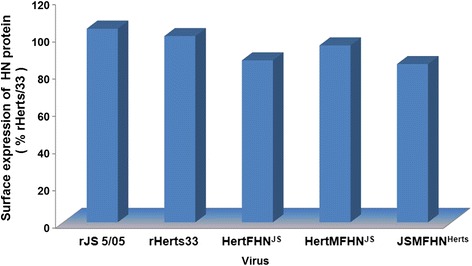
Fig. 5.

Expression quantity of HN protein on cell surface. The cell surface expression of the glycoprotein HN was determined by the FACS analysis. The DF1 cells infected at MOI of 0.001 were incubated with mAb 6B1 and goat anti-mouse IgG-FITC in turn. The HN expression level was reflected by the fluorescence intensity compared to the parental virus rHerts/33
