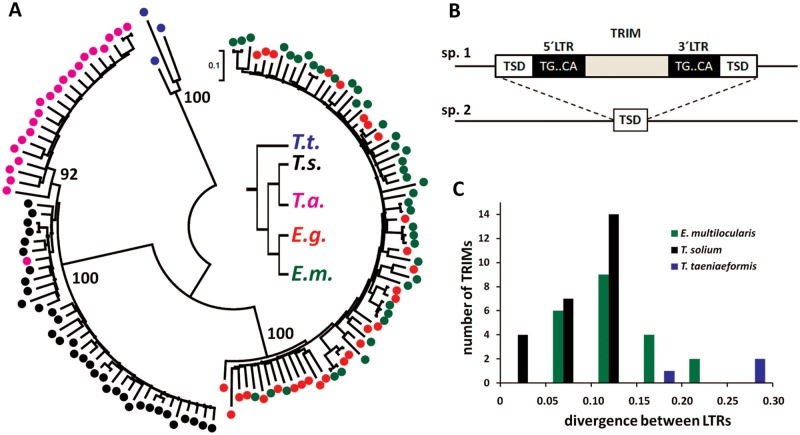
Fig. 2.—
Evolution and insertions of ta-TRIMs. (A) Phylogenetic tree of ta-TRIMs from taeniid species, inferred by maximum-likelihood analysis (Kimura 2-parameter model with gamma distributed sites). Bootstrap values (1,000 replicates) are indicated next to selected nodes. The inset shows the tree of taeniid species (drawn from the data of Nakao et al. 2013), using the same color code as for the species of the ta-TRIM elements. Eg, E. granulosus; Em, E. multilocularis; Ta, T. asiatica; Ts, T. solium; Tt, T. taeniaeformis. (B) Diagram explaining the identification of insertion sites between closely related species (sp.1 and sp.2). (C) Histogram showing the divergence between 5′- and 3′-LTRs for ta-TRIMs of three taeniid species (see the text for details).

