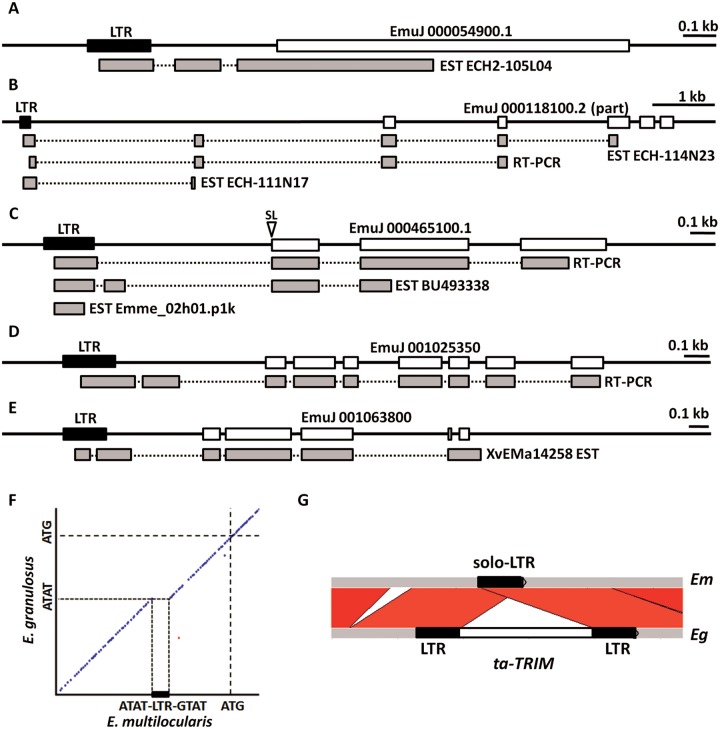
Fig. 5.—
Transcriptional fusions of solo-LTRs and downstream coding genes. Drawings are as in figure 4. “RT-PCR” indicates sequenced RT-PCR products obtained in this work. The white arrowhead (SL) in panel (C) indicates the position of the trans-splicing acceptor site in the ortholog of E. granulosus. Not all alternative splicing isoforms that were found are shown. (A) Locus 2. (B) Locus 8. (C) Locus 21. (D) Locus 60. (E) Locus 64. (Loci numbers are as found in supplementary data S8, Supplementary Material online). (F) Dot plot (identity within 10-bp windows is shown as dots) of the 2-kb region upstream of the start codon (ATG) of EmuJ_000465100 (Locus 21: horizontal axis) and the ortholog region of E. granulosus. The solo LTR (rectangle) is precisely lacking in E. granulosus, and a similar sequence (5′-ATAT-3′) is seen at this position as in the TSDs of the solo-LTR of E. multilocularis. (G) Comparison of the upstream region of locus 64 in E. multilocularis (Em), where a solo-LTR is found, with the ortholog region in E. granulosus (Eg), containing a full length ta-TRIM. Diagonal bars indicate BLASTN hits. Drawing generated with WebACT (Abbott et al. 2005).

