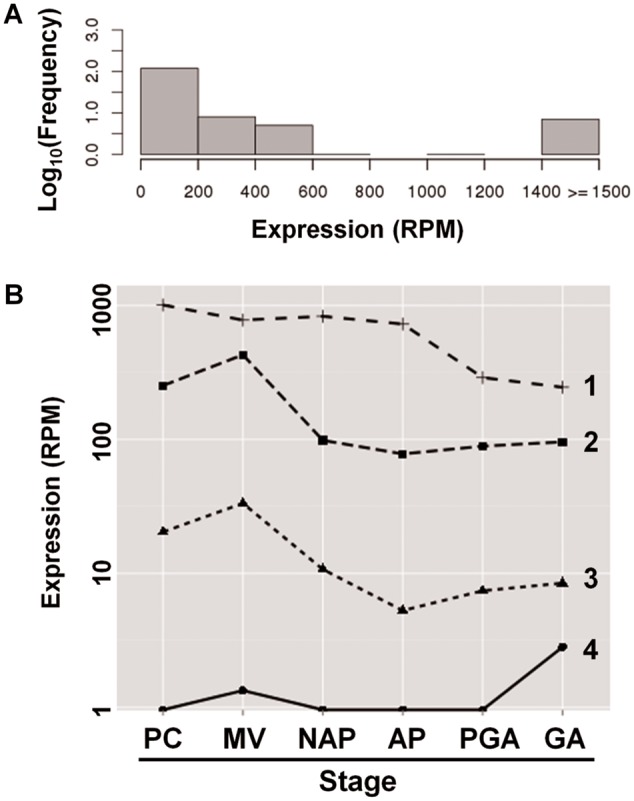
Fig. 6.—

RNA-Seq analysis of ta-TRIMS in E. multilocularis. (A) Histogram showing the distribution of expression levels of individual full-length ta-TRIMs (average of reads per data set, normalized per 106 uniquely mapping reads [RPM]). (B) Expression of representative individual full-length ta-TRIM elements (in Log scale) across data sets (PC, primary cells; MV, metacestode vesicles; NAP, nonactivated protoscoleces; AP, activated protoscoleces; PGA, pregravid adults; GA, gravid adults). For the selection of the representative elements, all ta-TRIMs were divided into four bins according to their RPM values (1–4), and the ta-TRIM with the median RPM value for each bin was selected and graphed.
