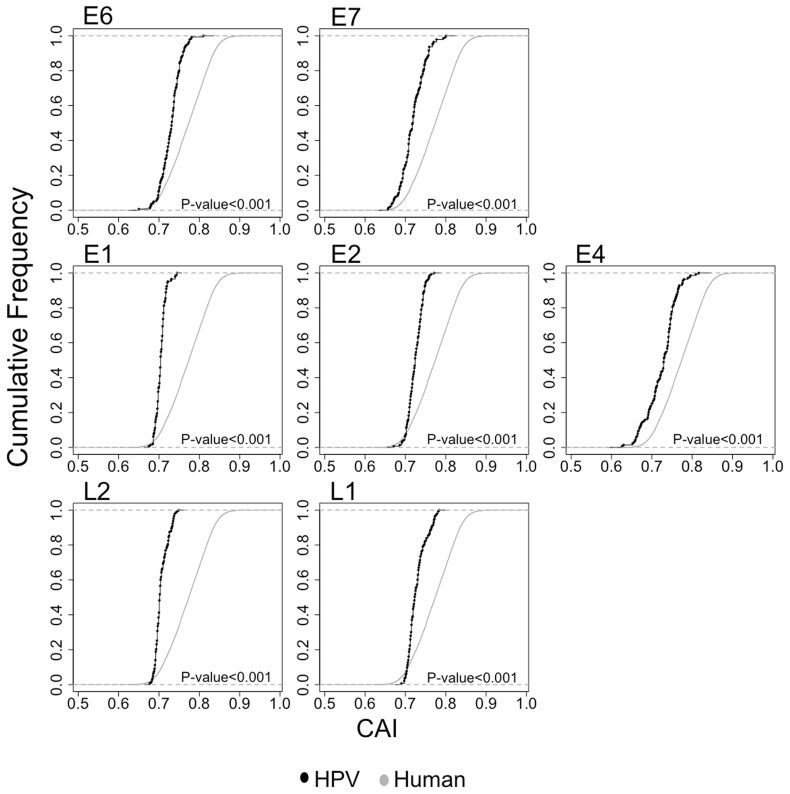
Fig. 1.—
Cumulative frequency plot showing the distribution of CAI values of HPVs and human epithelial genes. CAI values for HPV genes were calculated for every gene separately, using the human mean codon usage as a reference set. CAI values of HPV genes are represented in black. CAI values for human genes expressed at epithelial cells are represented in grey. Statistical differences in CAI values between human and HPV genes were assessed by a WMW test.

