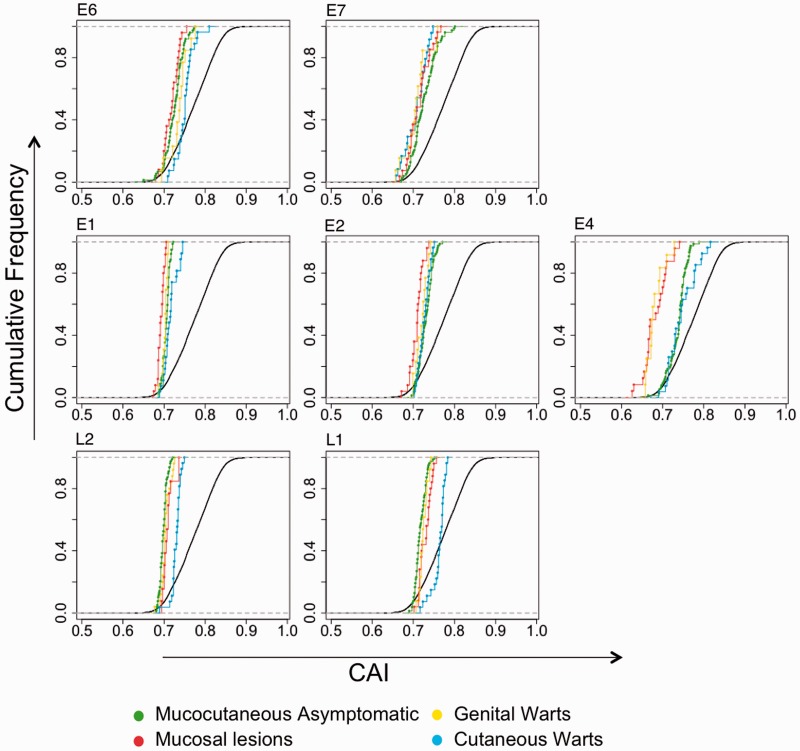
Fig. 2.—
Cumulative frequency plot of CAI values for human and HPV genes stratified by clinical manifestation. CAI values of each HPV gene were computed on the basis of CUPrefs in human genes. In green are represented CAI values of mucocutaneous asymptomatic HPVs (both Beta- and GammaPVs). In red, HPVs that cause mucosal lesions. In yellow, HPVs that cause genital warts. In blue, HPVs causing cutaneous warts. In black, human epithelial genes.

