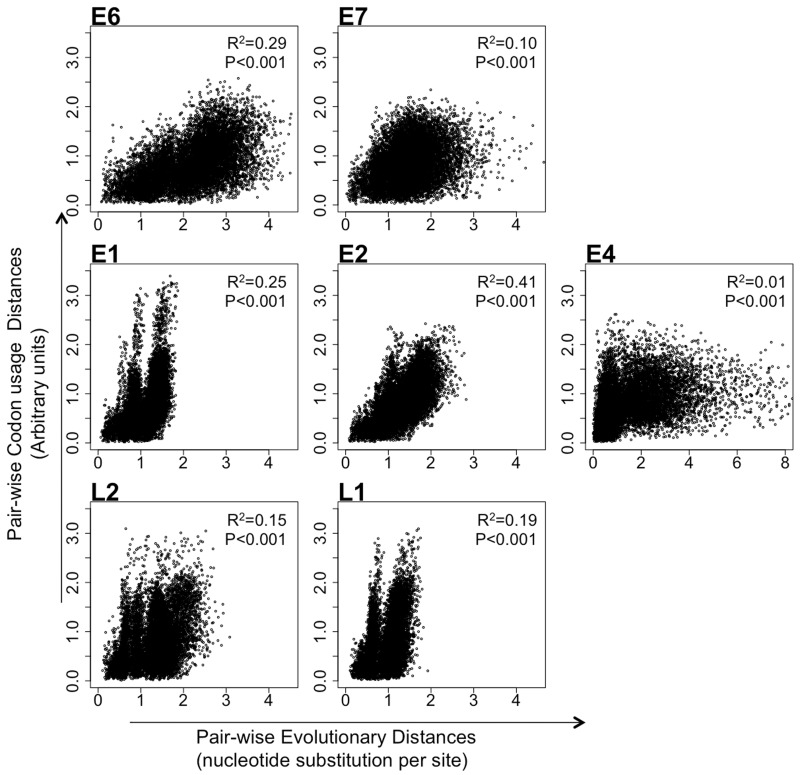
Fig. 4.—
Scatter plot of the evolutionary distances and the CUPref-based distances in the complete data set for each HPV gene. For all plots, x-axis represents evolutionary pairwise distances and y-axis represents CUPref-based pairwise distances. Phylogenetic distances were obtained with RAxML for every gene separately. The correlation coefficient and P value obtained after Pearson’s analysis are reported for each bivariate analysis.

