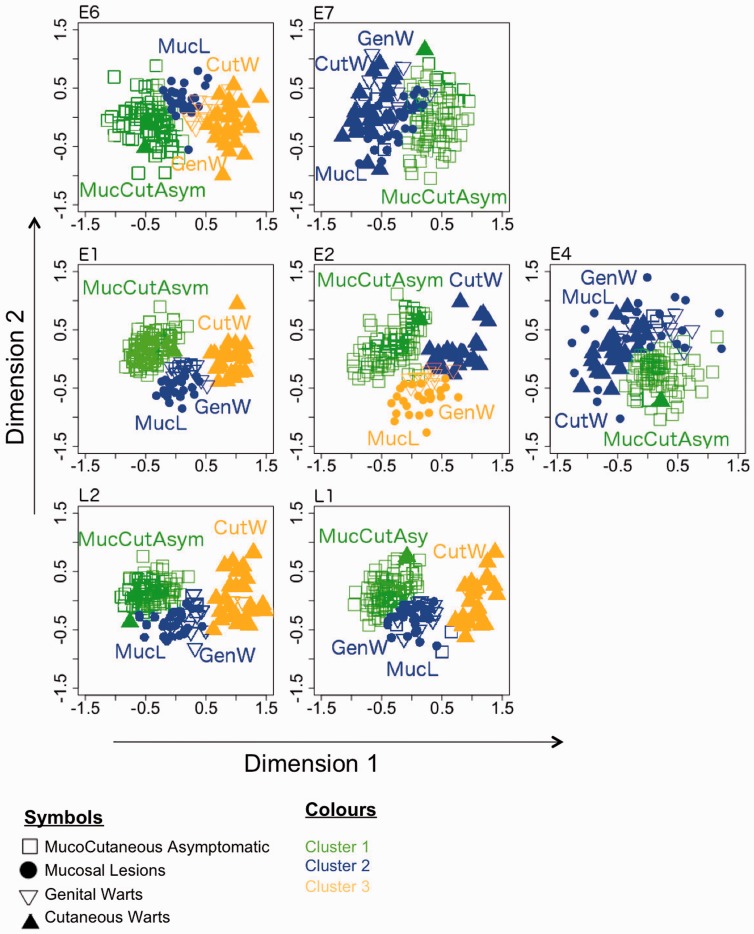
Fig. 5.—
MDS plot of codon usage differences among HPVs. The different HPVs are classified by an unsupervised two-step clustering algorithm, and visualized by MDS dimension reduction. The clusters are colored yellow (cluster1), blue (cluster 2), and green (cluster 3), respectively. Cluster analysis has been conducted for each gene separately; for this reason, “cluster 1” represents a totally independent set of PVs for each gene. Each symbol represents one individual HPV, and the distance between points is proportional to the overall dissimilarity of CUPrefs. Codes for phenotypic presentation of the infection: Squares, mucocutaneous asymptomatic; dots, mucosal lesions; inverse triangles, genital warts; triangles, cutaneous warts.

