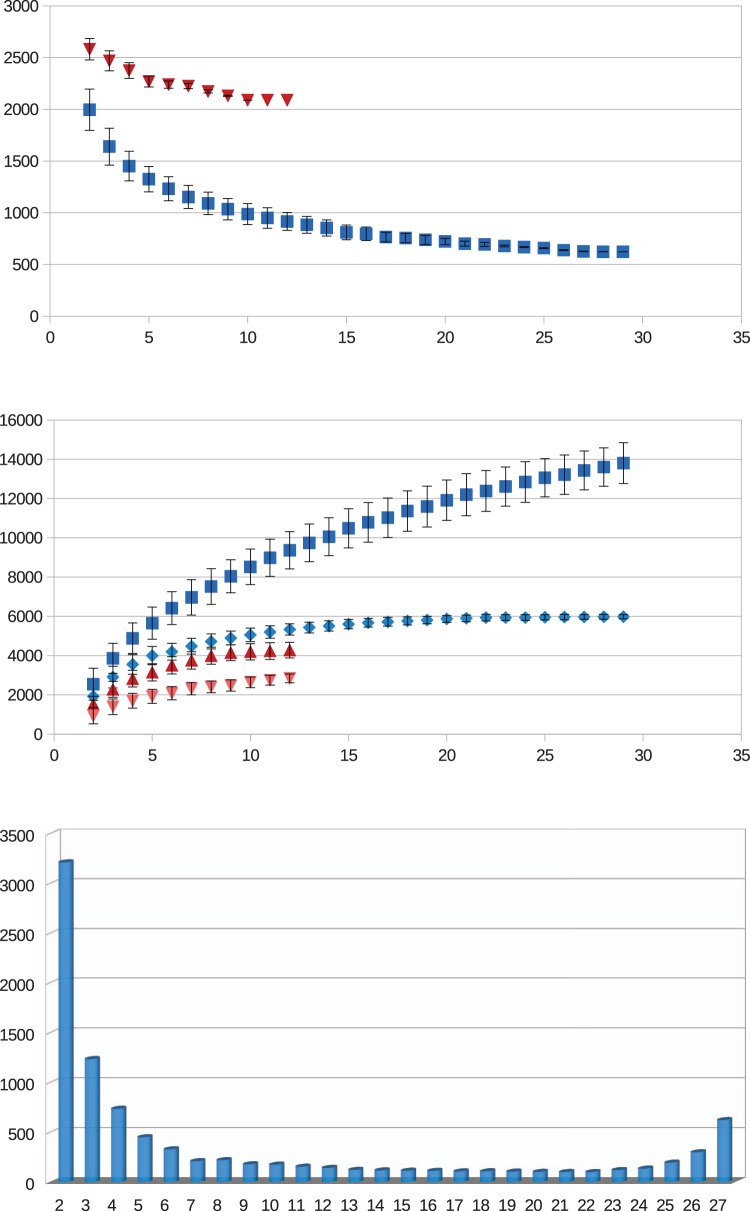
Fig. 2.
—Estimation of completeness of core and accessory genomes by rarefaction analyses. Core and accessory genome sizes were calculated on randomly resampled combinations of Listeria genomes. Trends according to numbers of genomes sampled are presented. Error bars represent standard deviations over 10,000 experimental replicates. (A) Core genome rarefactions for Listeria sensu strictu (red triangles) and the complete genus Listeria sensu lato (blue squares). (B) Accessory genome rarefactions for Listeria sensu strictu without singleton genes (light red triangles), with singleton genes (dark red triangles) and Listeria sensu lato without singleton genes (light blue diamonds) with singleton genes (dark blue squares). (C) Frequency distribution of number of entries in inferred COGS for all Listeria genomes used in this study.

