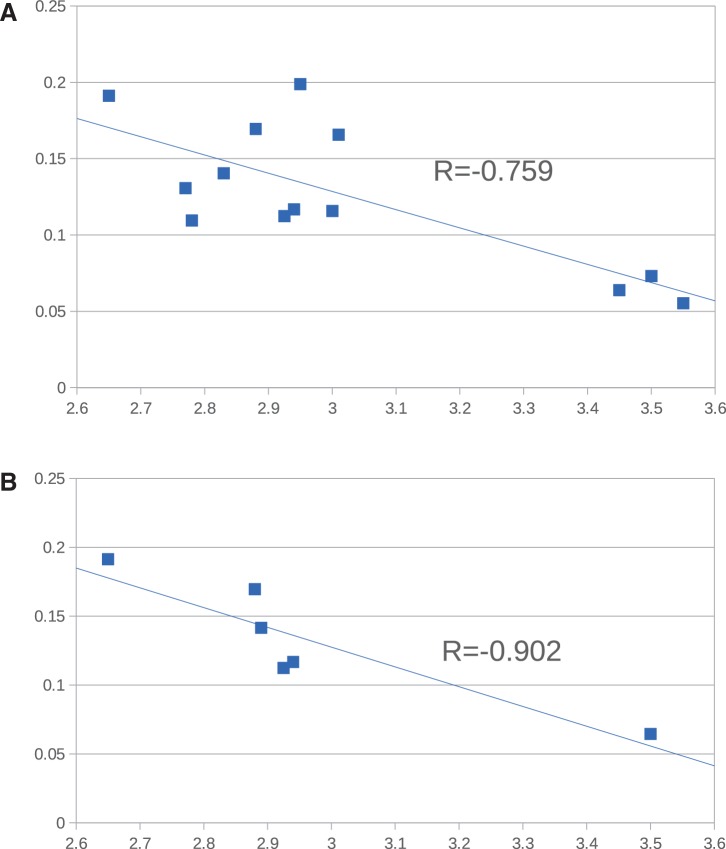
Fig. 4.
—Correlation between dN/dS for core genes and genome size for intraspecific comparisons within Listeria. Ratios of nonsynonymous to synonymous substitution rates were calculated for cospecific genomes from 623 Brochothrix/Listeria core genes and correlated with genome size. (A) Scatterplot including permutations of L. fleischmannii and L. newyorkensis intraspecies comparisons. (B) Scatterplot including single L. fleischmannii and L. newyorkensis intraspecies comparisons.

