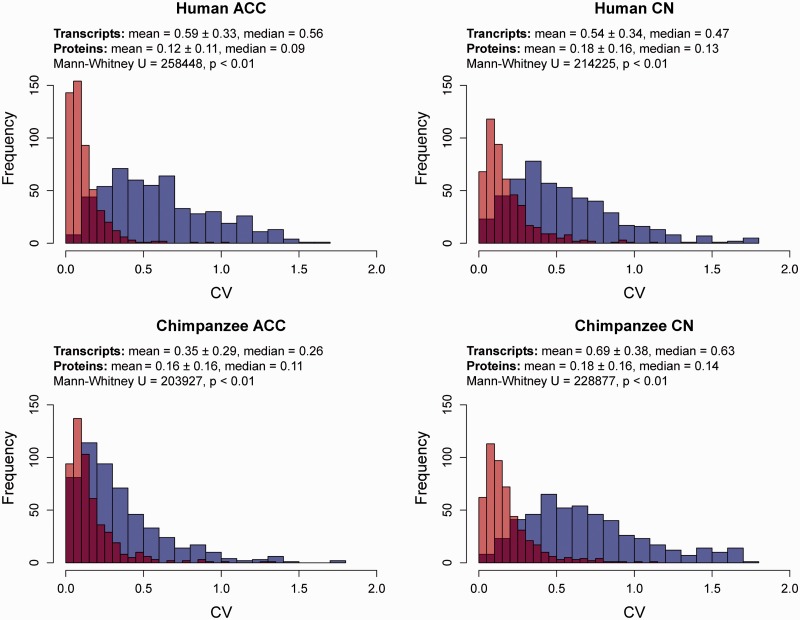
Fig. 1.—
The frequency bar graphs of interindividual CVs for transcript (blue) and protein (red) expression in ACC and CN in humans and chimpanzees using the paired data sets. The overlap between these two distributions appears as a darker (purplish) color. The results of Mann–Whitney tests comparing the central tendencies of transcript and protein expression are provided.

