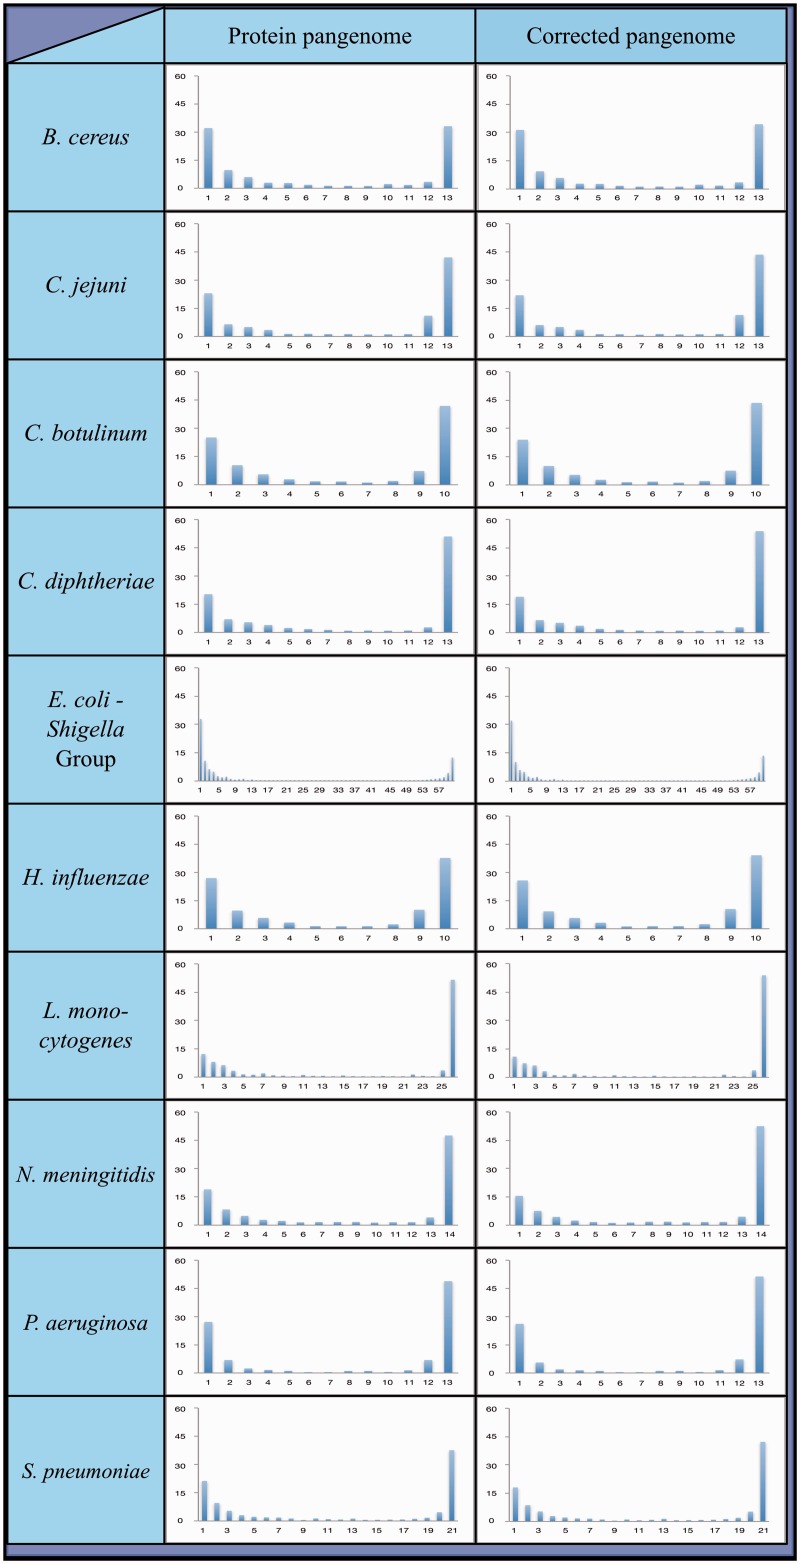
Fig. 2.—
Pangenome plots of ten recombining bacterial species. To generate these plots, all strains within a species were compared and orthologous genes were clustered together into groups. This allows for the calculation of the frequency with which each cluster of orthologous genes (referred to as a “pangene”) is found among members of its species. Depicted are the distributions of frequencies with which pangenes are found within each species. Two plots are provided for each species: Left: Protein pangenome plot—generated based on annotated protein sequences; Right: HGT-artifact corrected pangenome plot—the protein pangenome was compared with the full DNA sequences of the strains from which it was generated. Pangenes appearing in less than 50% of strains within a species at the annotated protein level, but in more than 75% of the strains at the whole DNA level, were removed from the plot.

