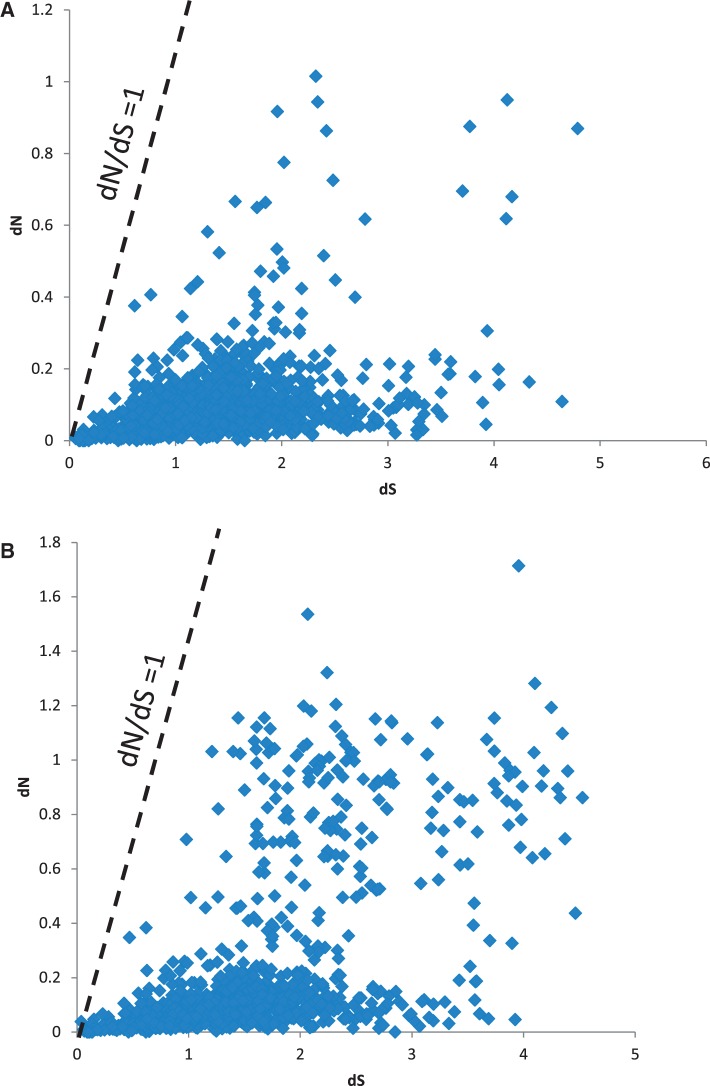
Fig. 4.—
Plot of dN versus dS of orthologous genes between BFo1 and E. tasmaniensis. Plot of dN versus dS for all orthologous gene pairs between the nonpathogen, free living E. tasmiensis and BFo1. (A) BFo1 isolated from UK population of F. occidentalis. (B) BFo1 isolated from the Netherlands population of F. occidentalis. Each point represents an orthologous gene pair. Dotted line indicates neutrality (dN = dS).

