Abstract
Most sequenced eukaryotic genomes show a large excess of recent duplicates. As duplicates age, both the population genetic process of failed fixation and the mutation-driven process of nonfunctionalization act to reduce the observed number of duplicates. Understanding the processes generating the age distributions of recent duplicates is important to also understand the role of duplicate genes in the functional divergence of genomes. To date, mechanistic models for duplicate gene retention only account for the mutation-driven nonfunctionalization process. Here, a neutral model for the distribution of synonymous substitutions in duplicated genes which are segregating and expected to never fix in a population is introduced. This model enables differentiation of neutral loss due to failed fixation from loss due to mutation-driven nonfunctionalization. The model has been validated on simulated data and subsequent analysis with the model on genomic data from human and mouse shows that conclusions about the underlying mechanisms for duplicate gene retention can be sensitive to consideration of population genetic processes.
Keywords: gene duplication, fixation, copy number variation, nonfunctionalization
Introduction
Gene duplication is thought to be a major source of molecular evolutionary novelties (Ohno 1970). Duplicate genes, like every type of genetic change, arise through mutation and then segregate through a population until they are eventually fixed or lost. Immediately after duplication, genes are expected to have redundant functions, and only a small fraction of duplicated genes are expected to be retained. During the fixation process, duplicates are assumed to be unconstrained by the selective pressures exerted on the initial copy and can accumulate deleterious changes (Zhang 2003; Innan and Kondrashov 2010).
Often, one member of a duplicated pair becomes silenced through degenerative mutations, a process known as nonfunctionalization. Though most fixed genes nonfunctionalize, some undergo neofunctionalization whereby one of the duplicates acquires a beneficial mutation which leads to a gain of function. Under another possible scenario known as subfunctionalization, each copy can adopt portions of the initial gene’s function and be retained to perform (possibly with greater efficacy) the original task (Hughes 1994; Lynch and Force 2000; Innan and Kondrashov 2010). Distinguishing between these different processes is important to understanding the role that gene duplication and duplicate gene retention play in the functional divergence of genomes.
Each of the mechanisms of retention can be identified by distinct instantaneous rates of loss (hazard rates) (Lynch and Conery 2000; Hughes and Liberles 2007; Konrad et al. 2011; Teufel et al. 2014) associated with the expected waiting time and number of changes for the processes to act. The hazard rate describes the instantaneous probability that a gene that has survived to that age will be lost, and it can be used to calculate the expected survival function describing the probability of observing genes of at least a certain age (Liberles et al. 2013; Teufel et al. 2014). The silencing of duplicates that are effectively neutral is expected to lead to a constant loss rate throughout time, consistent with exponential decay (Lynch and Conery 2000, 2003a, 2003b). However, the loss dynamics of duplicate genes associated with selective pressures are more complex. Duplicate genes which gain a novel function are characterized by a loss rate which declines convexly over time to a lower asymptote reflective of the distribution of waiting times across genes for an adaptive substitution. Duplicate genes that underwent a division of function behave similarly, though due to an increased waiting time for multiple complementary mutations, exhibit a concave pattern of decay in the hazard function before reaching the lower asymptote (Hughes and Liberles 2007; Konrad et al. 2011; Teufel et al. 2014). This framework, based upon the differential retention of duplicates, is used to describe a survival function that is consistent with the curve shapes associated with different patterns of retention associated with, for example, exponential decay (associated with nonfunctionalization), exponential decay plus a waiting time for a single beneficial substitution (associated with neofunctionalization), and exponential decay plus a waiting time for multiple deleterious substitutions (associated with subfunctionalization) (Konrad et al. 2011).
Recently, work has been performed using these characteristic instantaneous rates of loss to predict duplicated gene fate from genomic data (Hughes and Liberles 2007; Konrad et al. 2011). When examining rates of loss, the assumption is made that the duplicates sampled from genomic data are fixed in a population (as well as a constant rate of duplication; see Teufel et al. 2014 for more details on the analysis). Considering that most duplicated genes are lost during the segregation process, the amount of copy number variation across a population is expected to vary in a temporally biased manner. This implies that even if a duplicate is observed in a genome at a given age, it may never fix in the population.
As indicated, the loss patterns associated with different mechanisms of gene duplicate retention exhibit distinct hazard rates. However, segregating and fixed copies are lost at different rates too. As both of these processes are occurring simultaneously, observed loss rates are expected to be due to a combination of retention mechanisms and the segregation/fixation process. Current methods based on the analysis of loss rates are centered on the idea that all of the observed loss is associated with mutation. Conflation of the loss processes could lead to inappropriate support for nonneutral retention processes. Fortunately, both of the processes which contribute to the observed loss can be separated from one another. Loss due to mutational processes is assumed to occur through nonfunctionalization (which is time-independent). Failed fixation of segregating copies is time-dependent. Here, we introduce a neutral model for the distribution of the number of synonymous substitutions per silent site (dS) observed in gene duplicates that have not and will not become fixed. This model is then used to calculate the expected amount of segregating copy number variation in published data sets from Homo sapiens and Mus musculus (Lynch and Conery 2000), and the decay dynamics of these segregating variants are discussed.
Materials and Methods
Model Evaluation by Simulation
Theoretical results for the eventual failed fixation of segregating duplicates were evaluated with the use of a forward time simulation with discrete generations, in which 100 individuals were evolved over a gene tree for 5,000 generations, performed with 10 replicates. Each gene duplicated with probability 6.6 × 10⁻⁴ per gene and generation, and diverged with mutations as described by a Poisson process with rate λ(t) (for a single gene) with μ = 5.0 × 10⁻⁵ mutations/site/generation to generate synonymous changes, as described below. Individuals were sampled with replacement to populate the next generation. Duplicate genes that were segregating or fixed in the population were recorded every generation. At the end of 5,000 generations, the ratio of the ages of the duplicate genes that segregated at that time and ultimately failed to fix to the total number of genes of that age was calculated. After 5,000 generations, some duplicates had been neither fixed nor lost for the ages in dS indicated. These duplicates were treated as not having failed to fix and the theoretical expectation included the number that would fail to fix but were still expected to be segregating at 5,000 generations as not having failed to fix. This was calculating by only integrating up to 5,000 generations. The simulation was run ten times and the mean results were compared with from the theoretical model, evaluated for the case of haploid individuals using the described population size, mutation rate, and number of generations.
Genomic Data Analysis
Data sets generated by Lynch and Conery (2000) for dS < 0.3 and including duplicates with dS < 0.01 were obtained, including gene sequences and duplicate pair dS values. The age distribution of duplicate pairs was computed as counts in intervals of size ΔdS = 0.001 and scaled for duplicates with dS < 0.01 and in intervals of ΔdS = 0.01 for older duplicates with sparser data to reflect data density. The median dS value within each interval is used because the distribution of dS is right skewed within each group.
The General Death Model (GDM) from Konrad et al. (2011) was used to fit the process of loss in the human and mouse data sets. Each modeling regime was fit independently with a resulting likelihood used for model selection involving Akaike information criterion (AIC). The AIC scores calculated by where n is the number of data points, p is the number of parameters, and RSS is the residual sum of squares (Burnham and Anderson 1998) that are given in table 1, P–P and Q–Q plots of these fits are given in the supplementary material, Supplementary Material online.
Table 1.
AIC Values Based on Data Fit to the GDM Where Parameters Were Bounded to Regions Associated with Nonfunctionalization, Neofunctionalization, and Subfunctionalization
| Process Data Set | Nonfunctionalization | Neofunctionalization | Subfunctionalization |
|---|---|---|---|
| Homo sapiens | 391.6814 | 316.7605 | 316.7602 |
| Homo sapiens minus variation | 369.1835 | 315.5133 | 315.5139 |
| Mus musculus | 362.9716 | 285.7846 | 285.7821 |
| Mus musculus minus variation | 259.2429 | 209.8359 | 209.8358 |
Note.—The smallest AIC value listed is in bold, in some cases with very weak support.
Results
Theoretical Distribution of Loss due to Failed Fixation
If the number of silent sites is known, dS can be used to calculate the number of changes (k) that have accumulated between the two gene lineages since the time of duplication (at which point k began at zero). Assuming that silent mutations accumulate in the two lineages according to a Poisson process with rate , then a gamma distribution describes the time t for k substitutions to occur:
If the rate at which substitutions occur () is given in terms of substitutions (in either branch) per generation, this distribution gives the probability that t generations were necessary to observe k substitutions. The variable t can be treated as being continuous even if time is measured in terms of discrete generations. As allows for the number of substitutions to be expressed as a probability distribution of generations, Kimura (1955) can then be employed to model the duplicate gene fixation process in terms of generations. Note that when discussing the accumulation of mutations, of which some fraction will be lost during segregation, the terms dS and substitutions are retained when referring to synonymous mutations independent of their eventual fate in the population.
The expected amount of neutral, segregating variation of age t that will never fix can be obtained by using an expression given by Kimura (1955) for the probability density of the frequency x (0 < x < 1) of an allele at generation t.
The probability an allele has not yet fixed but will eventually fix can be attained in a similar fashion.
Where , p is the initial frequency of the allele (here 1/2Ne), and is the hypergeometric function describing the probabilities of sampling from a population (Kimura 1955). Note that by using Kimura’s equation, we make the simplifying assumption that genetic drift is Markovian, with no hitchhiking, background selection, or other factors which could lead to a shift in the shape of the neutral allele frequency spectrum here described by .
For a given number of substitutions (k), the probability that an observed duplicate has not and will not become fixed is given by calculating the ratio of duplicates with k substitutions that will fail to fix to the total number of duplicates with k substitutions, integrating over backwards time representing the age of duplicates
where is the expression for the probability of a gene being fixed in a population by the tth generation (Kimura 1955), and for large effective population size, x can be treated as a continuous variable without substantial error. For full details on the derivation of and , see Kimura (1994).
It is assumed that the mutation rate (μ) is 2.3 × 10⁻⁸ per base per generation (Lynch and Conery 2003a), the effective population size for H. sapiens is 1.40 × 10⁴ individuals (Kim et al. 2010), and the effective population size for M. musculus is 7.25 × 10⁴ individuals as averaged over the range of M. musculus effective population estimates (Phifer-Rixey et al. 2012). Tiessen et al. (2012) estimate the average length of a protein in H. sapiens as 456 amino acids (interquartile range = 163–562). Under the assumption of equal nucleotide frequencies and random substitution, the fraction of nucleotide changes that are silent is 23% (Nei and Gojobori 1986), which will decline with time as nonsynonymous mutations accumulate in both pairs. This suggests that the average number of silent sites per human protein is initially 315. As duplicate genes diverge from one another, the accumulation of nonsynonymous changes will cause a decline in the effective number of comparable silent sites. Initially after the duplication event, the number of comparable sites in a duplicate pair is the number of silent sites in both duplicates. The number of these sites decays as mutations which cause an amino acid change occur, given that approximately 23% of mutations are silent; this implies that 77% of mutations initially result in nonsynonymous changes. Considering the average number of silent sites (315) and the mutation rate (μ) and without modeling the equilibrium frequency of silent sites, the rate at which silent substitution occurs per duplicate pair per generation (λ(t)) can be expressed as
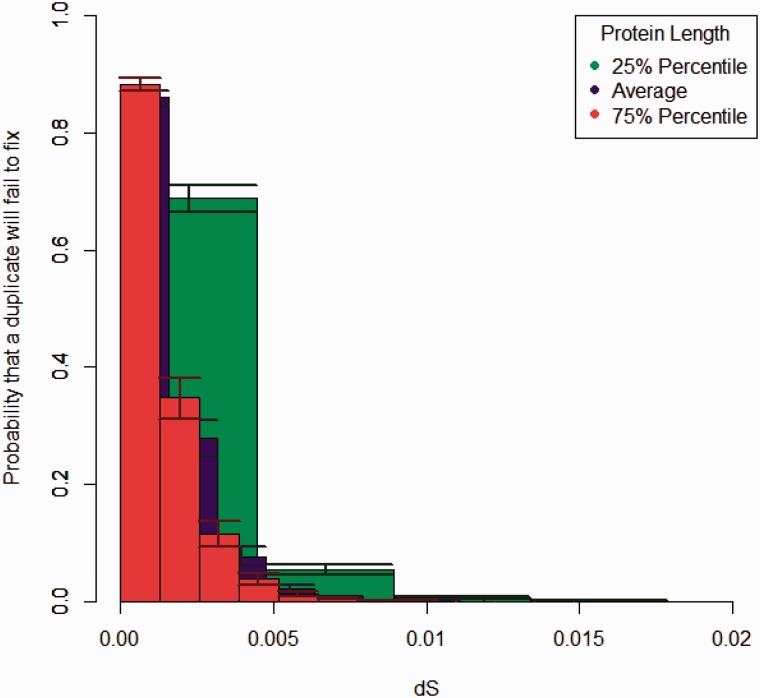
Substituting λ(t) into the expression for and calculating by integrating across all possible divergence times give the probability that a duplicate gene with a given dS value will fail to fix (fig. 1) assuming a set of proteins of average length, as well as protein lengths at the 25% and 75% percentile. The model above assumes a homogeneous mutational process, whereas Ohta (1976) has suggested that a negative binomial distribution is a better description of the substitution process, fitting the heterogeneity across sites. A similar method can be employed in this context by allowing the rate parameter λ(t) to be described by its own gamma distribution. This results in being expressed as a compounded gamma function.
Fig. 1.—
The probability that a duplicate of a given dS value has not and will not become fixed, shown for H. sapiens duplicate pair, is shown for various lengths, where each bin represents a single change. Error bars delineate variation in population size by 10%.
Figure 1 demonstrates the amount of neutral segregating variation for duplicates of average length, assuming homogeneity in mutation rate across sites with small dS values. This implies that approximately 86% (85–87%, when population size varies by 10%) of duplicate pairs with dS < 0.0022 (corresponding to a single change in the average protein) from which apparent gene loss is sampled in a genome will not be lost due to mutation-dependent processes.
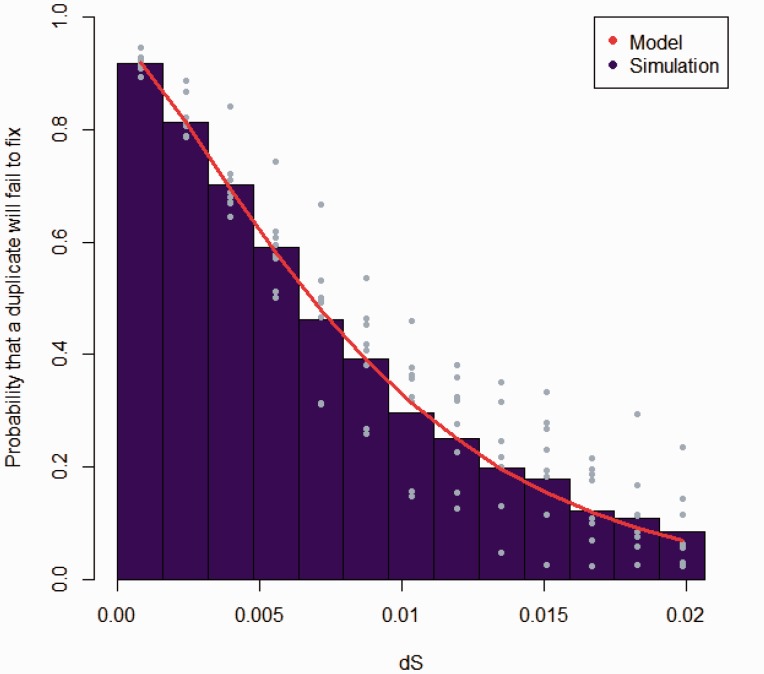
A simulation was designed to test the accuracy of the theoretical results. Figure 2 shows that the prediction of the model describes the known number of duplicates in a simulation that are observed to segregate at a given age and fail to fix. The simulation involved a forward time process of sampling with replacement using discrete generations of haploid individuals in a constant population size. An accounting of the number of duplicates that had neither fixed nor been lost by 5,000 generations was introduced as described. The differences in the observed fractions between figures 1 and 2 are expected according to differences in mutation rate and population size. P–P and Q–Q plots showing the correlation between simulated and theoretical results are presented as supplementary figure S1, Supplementary Material online.
Fig. 2.—
In evaluating the model describing the expectation of genes duplicated and failing to fix at different ages (measured in dS), the age distribution of duplicate genes from the model was compared with simulated data. Blue points denote the results of replicate simulations around the mean plotted as a bar. The theoretical expectation according to the model is shown with a red line. The time to fixation or loss was different from genomic data (fig. 1) due to differences in the mutation rate and population size.
Application of the Model to Genomic Data
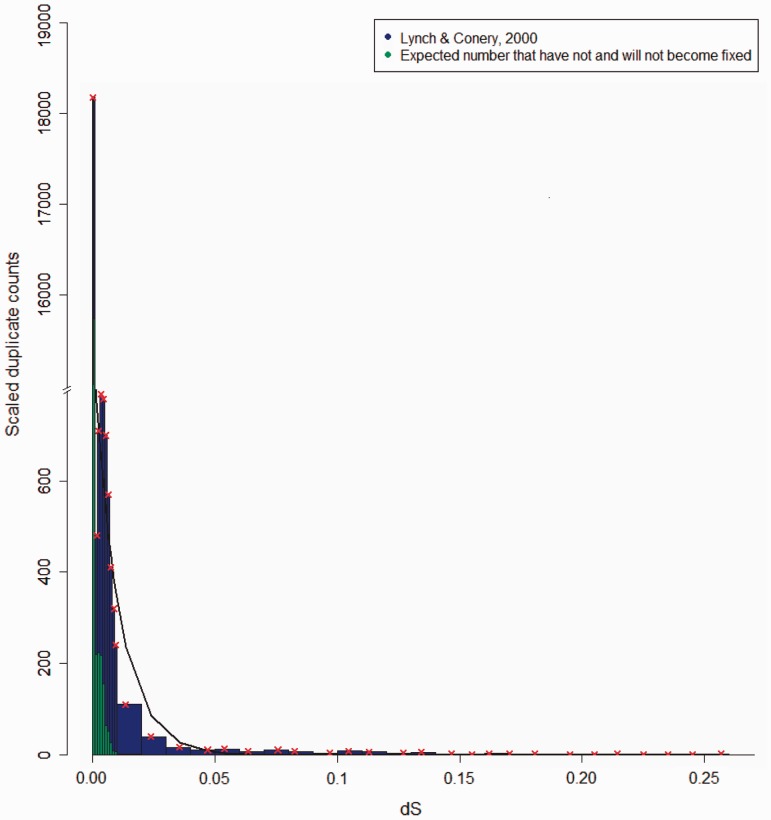
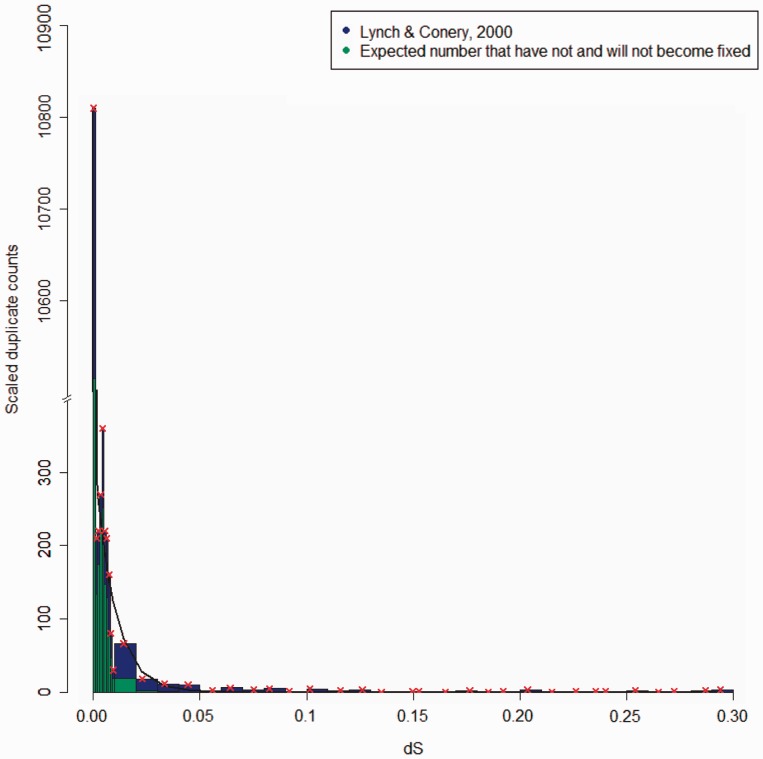
Applying the approach outlined above to data presented in Lynch and Conery (2000) for dS < 0.3 and including duplicates with dS < 0.01, the average numbers of silent nucleotide sites in the H. sapiens and M. musculus data sets are estimated to initially be 335 and 334, respectively. The age distribution of duplicate pairs was computed as counts as described in Materials and Methods. Figures 3 and 4 illustrate the distribution of dS values in Lynch and Conery’s (2000) duplicate pairs, and how many of those pairs likely represent duplications that have not and will not become fixed, based on . Figure 5 shows the corrected number of duplicates, where the expected amount of transiently segregating variation has been subtracted out for H. sapiens and M. musculus.
Fig. 3.—
The age distribution of H. sapiens duplicate pairs in interval of size ΔdS = 0.001 and scaled for duplicates with dS < 0.01 and in intervals of ΔdS = 0.01 for older duplicates from Lynch and Conery (2000) is shown. The red “x” denotes the median points of bins and the black line is the fit from the model best supported by AIC.
Fig. 4.—
The age distribution of M. musculus duplicate pairs interval of size ΔdS = 0.001 and scaled for duplicates with dS < 0.01 and in intervals of ΔdS = 0.01 for older duplicates from Lynch and Conery (2000) is shown. The red “x” denotes the median points of bins and the black line is the fit from the model best supported by AIC.
Fig. 5.—
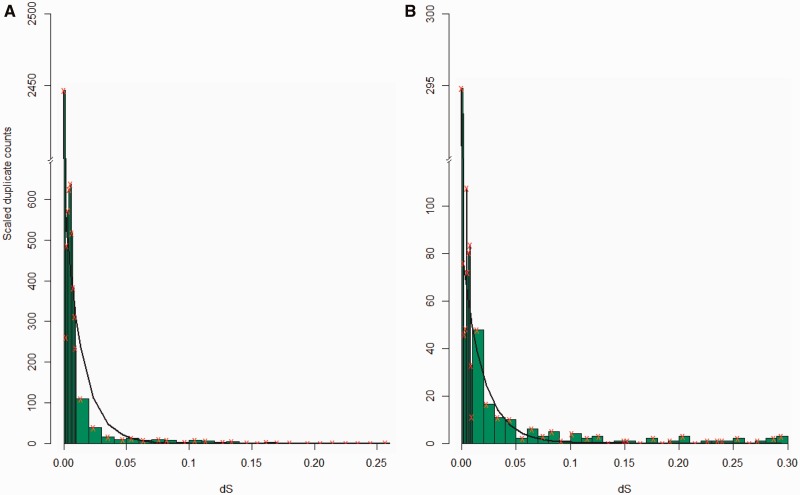
The age distributions when variation has been removed are shown as scaled duplicate counts for H. sapiens (A) and M. musculus (B). Here, the expected amount of species-specific variation that has not and will not become fixed has been subtracted out. The red “x” denotes the median points of bins and the black line is fit from the model best supported by AIC.
To examine the dynamics of nonfunctionalization, Lynch and Conery (2000) employed an exponential decay function , where N0 and the loss coefficient a were estimated and data with dS < 0.01 were not included in the analysis to prevent inclusion of alleles at the same locus. Comparison of loss coefficients of different species showed that duplicate loss rates become approximately constant relatively quickly compared with divergence time (as estimated by dS), suggesting that dynamics indicative of specific mechanisms of retention must occur early in the evolutionary history of a duplicate gene. Hughes and Liberles (2007) expanded on this idea using a stretched exponential decay function (the complementary cumulative Weibull distribution) , where the parameters a, b, and N0 were estimated to examine the loss rates of duplicates on a finer time scale. They demonstrated that the rate of pseudogenization decreases with time and suggest that neofunctionalization is the most common fate for smaller scale duplications which do not nonfunctionalize. Continuing on this line of work, Konrad et al. (2011) introduced the GDM where the parameters N0, a, b, c, d, and f are estimated. The GDM attempts to make inference from observed retention patterns about the mechanisms of duplicate retention by bounding parameters to ranges which are indicative of specific retention patterns. The GDM nests an exponential decay function when bounded to ranges related to nonfunctionalization; however, it does not explicitly nest a stretched exponential function, though it is capable of generating similar curve shapes associated with neofunctionalization. To examine the decay dynamics of the initial H. sapiens and M. musculus data and the data where expected species-specific segregating variation has been subtracted, these four data sets were fit to the GDM, as it has the ability to generate the decay dynamics of the other previously discussed models. For a discussion of the comparison of mechanistic and phenomenological models in this context, see Teufel et al. (2014).
In analyzing the H. sapiens data set (Lynch and Conery 2000), our comparison of AIC scores in table 1 suggests that the mechanism of subfunctionalization best describes the initial age distribution of duplicate genes and the mechanism of neofunctionalization best describes the distribution when segregating variation is removed, though the differences in the support of these mechanisms are nonsignificant (ΔAIC < 2). Differentiating between neofunctionalization and subfunctionalization in this framework is difficult. The similarity of the AIC scores suggests that the type of analysis employed in Hughes and Liberles (2007) and Konrad et al. (2011) could be susceptible to misidentification of the process of duplicate gene retention when segregating variation is not accounted for. Overall however, it would appear from table 1 that the conclusion reached in Hughes and Liberles (2007) that most duplicate genes in H. sapiens are evolving under nonneutral retention mechanisms is still valid even after accounting for the inflation of loss introduced by segregating variation.
Analysis of the GDM fit to M. musculus data (Lynch and Conery 2000) again suggests that nonneutral retention mechanisms are responsible for duplicate gene retention, though these dynamics most closely resemble those suggestive of subfunctionalization as opposed to neofunctionalization. However, the differences in the support of these models are also not statistically significant (table 1). This conclusion contrasts with that of Hughes and Liberles (2007), which demonstrates clear support for nonconstant decay associated with neofunctionalization as the dominant mechanism of duplicate gene retention in M. musculus. These conflicting results are most likely due to the differences in the data generation pipeline and the statistical tests performed in model evaluation, as the data generation pipeline and controls differed between the Lynch and Conery (2000) analysis and the Hughes and Liberles (2007) analysis, as did the modeling framework. This instance of differing methods of data filtering lending support for differing retention mechanisms demonstrates the importance of considering assumptions made during the bioinformatics data analysis pipeline (Teufel et al. 2014). When the expected amount of segregating variation is removed, support for retention through nonneutral retention processes increases.
Though the AIC values suggest improvement when segregating variation is removed from the data sets, this is not clearly reflected in the P–P and Q–Q plots (supplementary figs. S2–S5, Supplementary Material online). Examining the P–P and Q–Q plots of the model fit to data which includes segregating variation suggest that the GDM fits the combination of segregating variation and retention mechanism reasonably well. However, when the influence of segregating variation is removed, this evaluation of the fit appears to deteriorate because levels of misspecification which were previously masked by the signal of segregating variation become more apparent. The removal of segregating variation reveals the influence of additional levels of evolutionary complexity such as variation in duplication rate, which were originally indiscernible. The plots still do not show models that fit the data extremely well, suggesting that additional levels of mechanism need to be accounted for going forward.
Discussion and Conclusions
In the modeling framework that has been applied here, because the process is time-dependent in the underlying probabilities, it is formally non-Markovian. Alternative frameworks that formalize this as a multilayer Markovian process or as a quasi birth–death process have been discussed as well (Teufel et al. 2014). The information used to make inference in both the framework used in this article and the alternative frameworks is from time-dependent patterns of retention (when the genes are lost or gain preserving mutations/substitutions), but additional information is available in the time-dependent evolution of dN/dS (the ratio of nonsynonymous to synonymous nucleotide substitutions) and of functional attributes of a gene (like the expression profile or the set of physical interactions) (see, e.g., Hughes and Liberles 2007). With functional attributes, one needs to distinguish between functional divergence per se and the action of selection on functional divergence.
Gene duplication indeed has the ability to lead to functional divergence in genomes and a composite of processes gives rise to the age distribution of duplicates in a population. Analysis of loss patterns associated with duplicate genes can to lead to insight on how genes diverge. However, signal for mechanisms of mutation-driven gene duplicate retention can be mixed with underlying population genetic process signals. Here, we have introduced a model for the expected influence of the segregation/fixation process on the dS distribution of sampled duplicate genes and have applied this to data used to make mechanistic inferences from the age distribution of duplicate genes. Removal of segregating variation from the dS distribution of sampled gene duplicates in H. sapiens and M. musculus revealed how the aggregation of simultaneously occurring loss processes can lead to a convolution of signal from loss mechanisms associated with duplicate gene retention such that conclusions drawn from the analysis of the dS distribution can be affected. Although the model described here is based on expectations of population genetic processes and does not capture the full breadth of intricacies of molecular evolution, we have demonstrated the importance of accounting for the expectation of population genetics processes when attempting to make inferences about mechanisms of duplicate gene retention. Ultimate systematic consideration of underlying processes at multiple levels of organization can lead to more robust inference, even though it is necessary sometimes to start with simpler models and unrealistic assumptions about processes.
Supplementary Material
Supplementary figures S1–S5 are available at Genome Biology and Evolution online (http://www.gbe.oxfordjournals.org/).
Acknowledgments
The authors thank Liang Liu for helpful discussions of this project, as well as Tal Pupko and an anonymous reviewer. This work was supported by the National Science Foundation under Grant NSF DMS-1222940 awarded to D.A.L.
Literature Cited
- Burnham KP, Anderson DR. 1998. Model selection and inference: a practical information-theoretical approach. New York: Springer-Verlang. [Google Scholar]
- Hughes A. 1994. The evolution of functionally novel proteins after gene duplication. Proc R Soc Lond B Biol Sci. 256:119–124. [DOI] [PubMed] [Google Scholar]
- Hughes T, Liberles DA. 2007. The pattern of evolution of smaller-scale gene duplicates in mammalian genomes is more consistent with neo- than subfunctionalisation. J Mol Evol. 65:574–588. [DOI] [PubMed] [Google Scholar]
- Innan H, Kondrashov F. 2010. The evolution of gene duplications: classifying and distinguishing between models. Nat Rev Genet. 11:97–108. [DOI] [PubMed] [Google Scholar]
- Kim H, Igawa T, Kawashima A, Satta Y, Takahata N. 2010. Divergence, demography and gene loss along the human lineage. Philos Trans R Soc Lond B Biol Sci. 365:2451–2457. [DOI] [PMC free article] [PubMed] [Google Scholar]
- Kimura M. 1994. Population genetics, molecular evolution, and the neutral theory: selected papers. Chicago (IL): University of Chicago Press; p. 66–74. [Google Scholar]
- Kimura M. 1955. Solution of a process of random genetic drift with a continuous model. Proc Natl Acad Sci U S A. 41:144–150. [DOI] [PMC free article] [PubMed] [Google Scholar]
- Konrad A, Teufel AI, Grahnen JA, Liberles DA. 2011. Toward a general model for the evolutionary dynamics of gene duplicates. Genome Biol Evol. 3:197–209. [DOI] [PMC free article] [PubMed] [Google Scholar]
- Liberles DA, Teufel AI, Lui L, Stadler T. 2013. On the need for mechanistic models in computational genomics and metagenomics. Genome Biol Evol. 5:2008–2018. [DOI] [PMC free article] [PubMed] [Google Scholar]
- Lynch M, Conery J. 2000. The evolutionary fate and consequences of duplicates genes. Science 290:1151–1154. [DOI] [PubMed] [Google Scholar]
- Lynch M, Conery J. 2003a. The origins of genome complexity. Science 302:1401–1404. [DOI] [PubMed] [Google Scholar]
- Lynch M, Conery J. 2003b. The evolutionary demography of duplicate genes. J Struct Funct Genomics. 3:35–44. [PubMed] [Google Scholar]
- Lynch M, Force A. 2000. The probability of duplicate gene preservation by subfunctionalization. Genetics 154:459–473. [DOI] [PMC free article] [PubMed] [Google Scholar]
- Nei M, Gojobori T. 1986. Simple methods for estimating the numbers of synonymous and nonsynonymous nucleotide substitutions. Mol Biol Evol. 3:418–426. [DOI] [PubMed] [Google Scholar]
- Ohno S. 1970. Evolution by gene duplication. Berlin (Germany): Springer-Verlag. [Google Scholar]
- Ohta T. 1976. Simulation studies on the evolution of amino acid sequences. J Mol Evol. 8:1–12. [DOI] [PubMed] [Google Scholar]
- Phifer-Rixey M, et al. 2012. Adaptive evolution and effective population size in wild house mice. Mol Biol Evol. 29:2949–2955. [DOI] [PMC free article] [PubMed] [Google Scholar]
- Teufel AI, Zhao J, O’Reilly M, Liu L, Liberles DA. 2014. On mechanistic modeling of gene content evolution: birth-death models and mechanisms of gene birth and gene retention. Computation 2:112–130. [Google Scholar]
- Tiessen A, Pérez-Rodríguez P, Delaye-Arredondo LJ. 2012. Mathematical modeling and comparison of protein size distribution in different plant, animal, fungal and microbial species reveals a negative correlation between protein size and protein number, thus providing insight into the evolution of proteomes. BMC Res Notes. 5:85. [DOI] [PMC free article] [PubMed] [Google Scholar]
- Zhang J. 2003. Evolution by gene duplication: an update. Trends Ecol Evol. 18:292–298 [Google Scholar]
Associated Data
This section collects any data citations, data availability statements, or supplementary materials included in this article.


