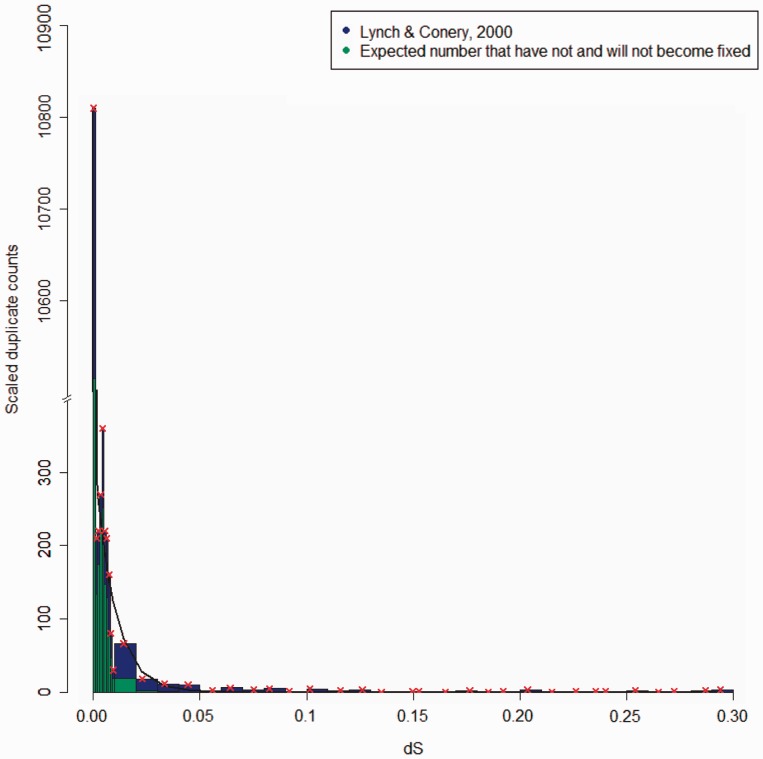
Fig. 4.—
The age distribution of M. musculus duplicate pairs interval of size ΔdS = 0.001 and scaled for duplicates with dS < 0.01 and in intervals of ΔdS = 0.01 for older duplicates from Lynch and Conery (2000) is shown. The red “x” denotes the median points of bins and the black line is the fit from the model best supported by AIC.

