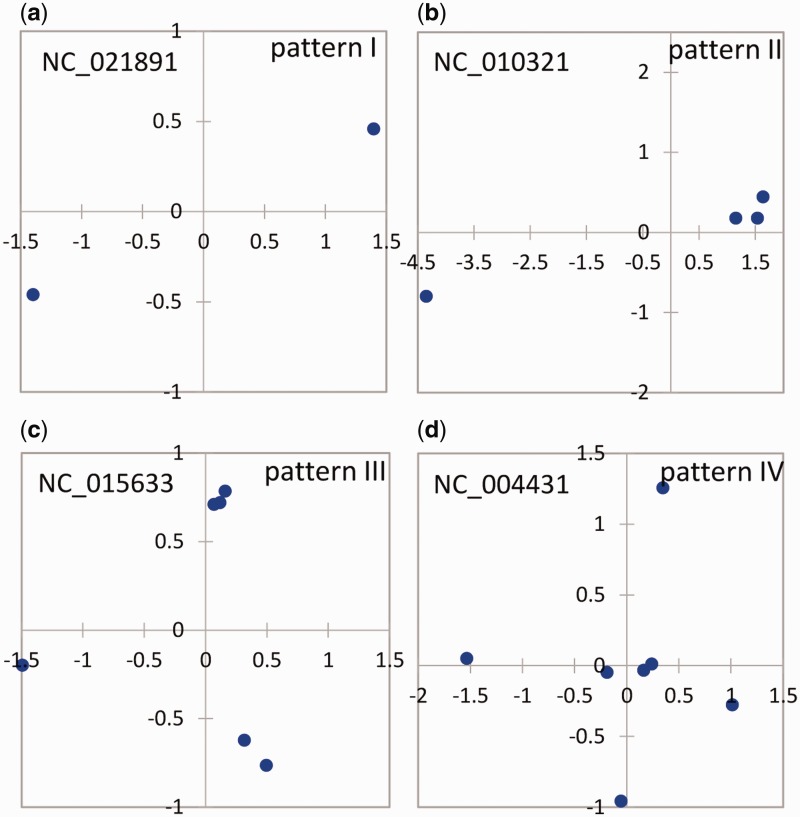
Fig. 2.
—MDS of four grouping patterns of the similarities of the multicopy 16S rRNA gene within single genomes with a high intragenomic heterogeneity of multiple 16S rRNA gene copies (lowest pairwise identity < 98.0%). Each dot indicates a copy of the 16S rRNA gene in the genome, and the distance between pairwise dots in the plot represents the dissimilarity between them.

