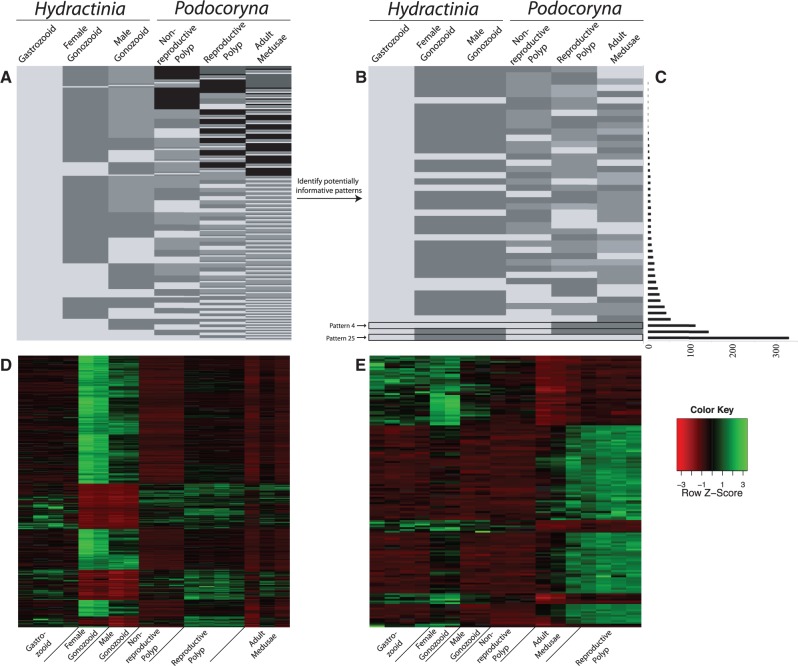
Fig. 4.—
Pattern reduction to informative patterns. (A) With six conditions (columns) present in the DE analysis, EBSeq identifies 203 possible expression patterns (rows). (B) Using biologically relevant constraints on expression in an attempt to reduce the noise in the DE signal, the number of patterns is reduced to 44 potentially informative patterns. Colors in this schematic do not indicate magnitude of expression, just nondirectional levels of expression to show statistically equivalent, and nonequivalent levels of expression between conditions in the analysis. (C) Bar graph of the number of DE genes (FDR < 0.05) specific to each 44 of the potentially informative patterns. (D) Z-normalized heatmap of all orthologs whose expression is consistent with “Pattern 25” in the FPKM data set, an expression that should contain sporosac-specific orthologs. (E) Z-normalized heatmap of all orthologs whose expression is consistent with “Pattern 4” in the FPKM data set, an expression that should contain genes specific to Podocoryna carnea reproductive polyps and adult medusae.

