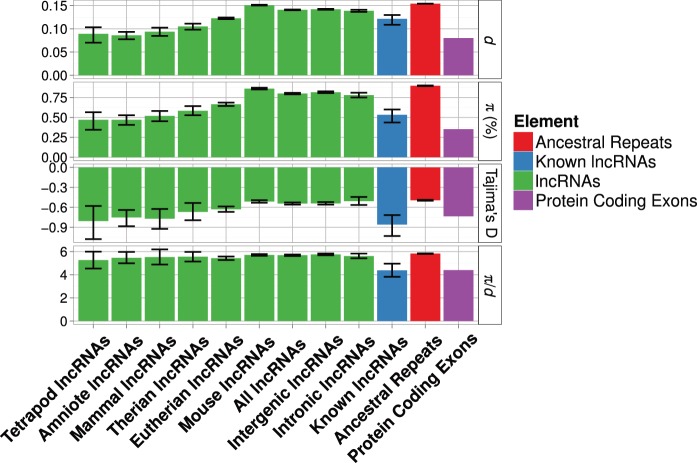
Fig. 1.—
Estimates of various diversity measures for each lncRNA age group. Groups are arranged along the x axis in descending order by evolutionary age from left to right. Error bars are bootstrapped 95% confidence intervals around point estimates. Estimates for lncRNAs of known function, intronic lncRNAs and intergenic lncRNAs, AR and PC exons are also shown for comparison.

